Produce shipments keep pressure on spot truckload rates
The number of spot market loads on the DAT network of load boards fell 1.2% and truck posts were down 3.2% during the week ending May 19. Freight activity varied from region to region as produce harvests across the Sun Belt, from California to the Carolinas, added to capacity pressures. At the same time, freight volumes cooled in the Northern states, more than offsetting any gains to the south.
The two opposing trends kept national average rates unchanged for dry van and refrigerated (reefer) truckload freight last week:
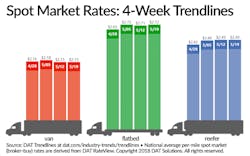
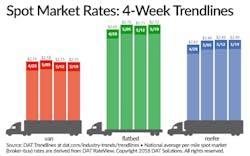
- Van: $2.15/mile, unchanged
- Flatbed: $2.72/mile, up 1 cent
- Reefer: $2.49/mile, unchanged
VAN OVERVIEW: Van load posts rose 1% while truck posts dropped 4%. The van load-to-truck ratio rose 5% to 6.7 loads per truck.
Demand for dry van freight transportation was most intense across the southern band of states, from California across and through the entire Southeast region. Last week Los Angeles overtook Dallas as the top market for freight volume; Dallas remained at No. 2 followed by Atlanta.
On the top 100 van lanes, the biggest rate jump was from Atlanta to Philadelphia, up 28 cents to $3.28/mile. Other rising lanes included:
- Atlanta to Chicago, up 23 cents to $2.26/mile
- Charlotte to Chicago, up 22 to $2.18/mile
- Los Angeles to Seattle, up 15 cents to $2.90/mile
FLATBED OVERVIEW: The national flatbed load-to-truck ratio has been historically high this year and last week was the first time the ratio has dipped below 100 since late March. Flatbed load posts were down 4%, but truck posts increased 2%, which led to a ratio of 96.9 loads per truck.
REEFER OVERVIEW: Reefer load posts rose 4% while truck posts declined 4%. As a result, the national load-to-truck ratio for reefers increased 9%, from 8.5 to 9.2 loads per truck.
The lane from Atlanta to Philadelphia posted the largest spot rate increases, with the average jumping 55 cents to $3.16/mile. Other lanes that showed strong increases included:
- McAllen, Texas, to Atlanta climbed 38 cents to $2.95/mile
- Ontario, California, to Seattle increased 35 cents to $3.41/mile
- Nogales, Arizona, to Dallas bumped up 31 cents to $2.91/mile
While rates and load-to-truck ratios rose for reefer vans across the South, all major lanes out of Miami and Lakeland, Florida, were down, with rates and volumes dropping steeply:
- Miami to Atlanta plunged 74 cents to an average of $2.38/mile
- Miami to Baltimore dove 59 cents to $2.91/mile
- Lakeland to Atlanta dropped 57 cents to $2.40/mile
This report is generated using DAT RateView, which provides real-time reports on prevailing spot market and contract rates, as well as historical rate and capacity trends.

