Fleetowner Com Sites Fleetowner com Files Uploads 2016 06 01 060116 Dat Spot Market Rates

DAT: Spot load volume up 8.5%

June 2, 2016
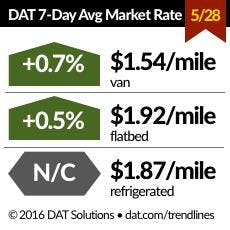
National average truckload van and flatbed rates each rose a penny on increased demand for capacity during the week ending May 28, according to DAT Solutions, which operates the DAT network of load boards. An 8.5% increase in the total number of available spot loads and higher diesel prices also played key roles in the spot rate picture.
National average truckload van and flatbed rates each rose a penny on increased demand for capacity during the week ending May 28, according to DAT Solutions, which operates the DAT network of load boards.

An 8.5% increase in the total number of available spot loads and higher diesel prices also played key roles in the spot rate picture.

19% More Reefer Loads

The number of posted reefer loads increased 19% as available capacity declined 5%, compared to the previous week. The result was a 4.1 reefer load-to-truck ratio, a 25% increase.

The national average reefer rate was unchanged at $1.87 a mile despite a seasonal increase in demand.

Van Demand Up 16%

The number of available van loads jumped 16% while the number of vans was unchanged last week. The van load-to-truck ratio gained 16% to 1.9 loads per truck.

At $1.54 per mile, the national average van rate rose 1 cent. Rates rose sharply on many high-volume lanes, however. By region, leading markets for average outbound spot rates include:

  • West: Los Angeles, $2.01/mile, up 8 cents
  • Midwest: Chicago, $1.74/mile, up 4 cents
  • South Central: Dallas, $1.50/mile, up 2 cents
  • Southeast: Charlotte, $1.82/mile, up 3 cents
  • Northeast: Allentown, Pa., $1.80/mile, up 2 cents

Flatbed L/T Ratio Falls 8%

Flatbed load availability dipped 0.5% while capacity increased 8% last week. That led to an 8% decrease in the flatbed load-to-truck ratio at 14.2 loads per truck. The national average flatbed rate increased 1 cent to $1.92 per mile.

Rates are derived from DAT RateView, which provides real-time reports on prevailing spot market and contract rates, as well as historical rate and capacity trends. All reported rates include fuel surcharges.

Load-to-truck ratios are a sensitive, real-time indicator of the balance between spot market demand and capacity. Changes in the ratio often signal impending changes in rates.

For complete national and regional reports on spot rates and demand, visit dat.com/Trendlines. DAT Trendlines is a weekly report on spot market freight availability, truck capacity, and rates.
Sponsored Recommendations

Reducing CSA Violations & Increasing Safety With Advanced Trailer Telematics

Keep the roads safer with advanced trailer telematics. In this whitepaper, see how you can gain insights that lead to increased safety and reduced roadside incidents—keeping drivers...

80% Fewer Towable Accidents - 10 Key Strategies

After installing grille guards on all of their Class 8 trucks, a major Midwest fleet reported they had reduced their number of towable accidents by 80% post installation – including...

Proactive Fleet Safety: A Guide to Improved Efficiency and Profitability

Each year, carriers lose around 32.6 billion vehicle hours as a result of weather-related congestion. Discover how to shift from reactive to proactive, improve efficiency, and...

Tackling the Tech Shortage: Lessons in Recruiting Talent and Reducing Turnover

Discover innovative strategies for recruiting and retaining tech talent in the trucking industry during this informative webinar, where experts will share insights on competitive...

Voice your opinion!

To join the conversation, and become an exclusive member of FleetOwner, create an account today!