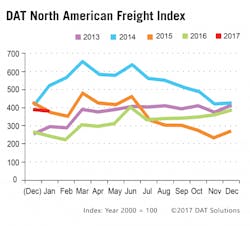
The DAT North American Freight Index edged downward in January as spot truckload freight settled into a typical post-holiday pattern, albeit at significantly elevated levels compared to this time last year.
The Freight Index dropped 2.5 percent in January compared to an exceptionally strong December and was 56 percent higher year over year, said DAT Solutions, which operates the industry's largest on-demand freight exchange for spot freight.
The DAT North American Freight Index edged downward in January as spot truckload freight settled into a typical post-holiday pattern, albeit at significantly elevated levels compared to this time last year.
Spot van, refrigerated, and flatbed rates in January were higher year over year, but an influx of capacity from contract carriers onto the spot market, particularly on high-traffic lanes, depressed rates compared to December.
"Coming off a high in December, January was still very solid for spot freight," said Don Thornton, senior vice president at DAT. "As a result we saw more contract carriers make their trucks available on load boards, and the added capacity contributed to lower rates on many high-traffic lanes.”
Compared to December, the volume of van freight on the spot market was down 9 percent last month but up 63 percent year over year. The national average rate for vans was $1.68 per mile including a fuel surcharge, down 5 cents compared to December but up 2 cents year over year.
Refrigerated freight followed a similar trend. The number of available loads fell 8 percent in January but was 57 percent higher year over year. Available capacity rose 1 percent.
The national average spot rate for refrigerated freight was $1.96 per mile including a fuel surcharge, 3 cents lower than December but 6 cents higher compared to January 2016.
Demand for flatbed trucks rose 18 percent compared to December and 64 percent year over year. Available capacity rose just 3 percent.
At $1.91 per mile, the national average flatbed rate was 5 cents lower compared to December but was 3 cents higher year over year.


