Study: Most populous states have more infrastructure woes
The best U.S. highways are in the Plains and the worst are in the Northeast, according to an 11-category ranking system used in the 23rd Annual Highway Report by the Reason Foundation.
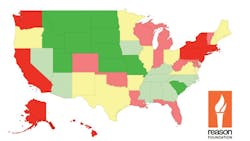
Looking at a map denoting the states with the best and worst infrastructure, it appears that the more populous a state, the more likely its roads are failing.
North Dakota was the top-ranked state on performance and cost-effectiveness thanks to its urban Interstate pavement condition (3rd overall), rural Interstate pavement condition (4th), urbanized area traffic congestion (4th), and maintenance disbursements per mile (3rd). Kansas, South Dakota, Nebraska and South Carolina were the other states in top five of the overall rankings.
New Jersey ranked last in overall performance and cost-effectiveness due to having the worst urban traffic congestion and spending the most per mile — $2 million per mile of state-controlled highway, more than double what Florida, the next highest state, spent per mile. Rhode Island, Alaska, Hawaii and Connecticut were also in the bottom five of the overall rankings.
The rankings are based on how each state does in 11 categories: Total disbursements per mile, capital and bridge disbursements per mile, maintenance disbursements per mile, administrative disbursements per mile, rural interstate pavement condition, urban interstate pavement condition, rural arterial pavement condition, urbanized are congestion, deficient bridges, fatality rates, and narrow rural arterial lanes.
Here is how the 50-state rank (you can click on each state for a detailed report of its infrastructure).
- North Dakota
- Kansas
- South Dakota
- Nebraska
- South Carolina
- Montana
- Idaho
- Wyoming
- Missouri
- Utah
- Mississippi
- Tennessee
- Kentucky
- North Carolina
- Iowa
- Arizona
- Alabama
- Georgia
- Delaware
- Nevada
- Oregon
- Texas
- Maine
- New Mexico
- Minnesota
- Ohio
- Virginia
- Illinois
- Arkansas
- New Hampshire
- Colorado
- Michigan
- Oklahoma
- Indiana
- Florida
- West Virginia
- Louisiana
- Wisconsin
- Vermont
- Maryland
- Pennsylvania
- California
- Washington
- Massachusetts
- New York
- Connecticut
- Hawaii
- Alaska
- Rhode Island
- New Jersey
Nearly half of the states (23 of 50) made progress compared to the previous Reason Foundation report on infrastructure. Two states, Iowa and Delaware, improved their overall rankings by double digits, while six states had overall rankings that worsened by 10 or more spots.
Here are some highlights from the report:
- Iowa improved 25 positions, from 40th to 15th in the overall rankings, as the state’s per mile spending increased somewhat but mileage in poor condition (on urban and rural Interstates and rural arterials) improved considerably.
- Delaware is up 18 spots, from 37th to 19th overall, as per mile spending decreased while mileage in poor condition (on urban Interstates and rural arterials) still improved.
- Wisconsin dropped 10 spots, from 28th to 38th, as per mile spending increased even as mileage in poor condition (on urban and rural Interstates) worsened.
- West Virginia fell 11 spots, from 25th to 36th, as the condition of its bridges worsened, as did the condition of its rural Interstates and arterials.
- New Mexico fell 13 spots, from 11th to 24th, as urban area congestion worsened and narrow rural arterial lane mileage increased.
- Oklahoma fell 16 spots, from 17th to 33rd, as per mile spending increased even as mileage in poor condition (on urban and rural Interstates and rural arterials) worsened considerably.
- Ohio fell 17 spots, from 9th to 26th, as per mile spending increased but the state’s road conditions worsened. Additionally, Ohio’s percentage of bridges in deficient condition jumped considerably as this year’s totals included functionally obsolete bridges, whereas in the last assessment, this information was not provided.
- Maine dropped 18 spots, from 5th to 23rd, as per mile spending increased even as the state’s road conditions (particularly urban Interstates) worsened.
A 10-year average of state overall performance data indicates that some states are having trouble improving their roads. Some major system performance problems seem to be concentrated in these states. The Reason Foundation provides these examples:
- Over half (53%) of the rural Interstate mileage in poor condition is in just eight states: Alaska, Colorado, New York, Wisconsin, Indiana, Texas, California and Washington.
- Over half (54%) of the urban Interstate mileage in poor condition is in just eight states: California, New York, Texas, Louisiana, Michigan, New Jersey, Pennsylvania and Ohio.
- Almost half (49%) of the rural primary mileage in poor condition is in just eight states: California, Alaska, Wisconsin, Iowa, Texas, Minnesota, Oklahoma and South Dakota.
- Automobile commuters in nine states (New Jersey, California, New York, Georgia, Illinois, Massachusetts, Texas, Washington and Virginia) spend more than the national average of 35 hours annually stuck in peak-hour traffic congestion.
- Although most states saw bridge conditions improve, overall national bridge conditions are worsening, with seven states (Rhode Island, Hawaii, New York, West Virginia, Massachusetts, Pennsylvania and Connecticut) now reporting more than one-third of their bridges as deficient.
- After decades of improvement, fatality rates are increasing and seven states (South Carolina, Montana, Mississippi, Kentucky, Arkansas, Wyoming and Louisiana) now have fatality rates greater than 1.5 per 100 million vehicle-miles traveled.
- Four states (West Virginia, Virginia, Pennsylvania and Vermont) report that more than one-third of their rural principal arterial systems have lanes considered narrow.
You can read the complete 23rd Annual Highway Report here.
About the Author
Fleet Owner Staff
Our Editorial Team
Kevin Jones, Editorial Director, Commercial Vehicle Group
Cristina Commendatore, Executive Editor
Scott Achelpohl, Managing Editor
Josh Fisher, Senior Editor
Catharine Conway, Digital Editor
Eric Van Egeren, Art Director
