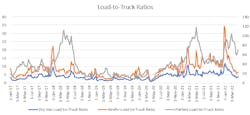
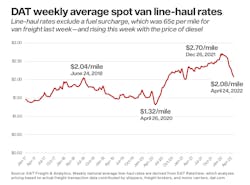
Loads posted to the DAT One network rose almost 5% during the week of April 24-30, signaling a late-month push by shippers and relatively strong truckload volumes overall. This is the second straight week of increases in load-posting activity to the DAT network.
Total truck posts fell 4% compared to the previous week, and load-to-truck ratios increased for all three equipment types. Typically, more loads and fewer trucks result in higher spot rates. However, national average weekly line-haul pricing declined compared to the previous week:
- Dry van freight fell 4 cents to an average of $2.08 a mile excluding a fuel surcharge. Van rates have not increased week over week since the first week of January.
- Reefers averaged $2.39 a mile, down 5 cents.
- The flatbed rate was $2.67 a mile, down 2 cents.
Rates are based on transaction data submitted by shippers, freight brokers, and motor carriers and exclude a fuel surcharge. Last week, fuel surcharge calculations in DAT’s RateView pricing analysis tool were 65 cents a mile for van freight; 71 cents for reefers; and 78 cents for flatbeds. Discrepancies are due to the fuel economy of the various equipment types.
See also: U.S. average diesel price shatters all-time high
The national average spot van rate (excluding fuel) is 15 cents lower year-over-year and the reefer rate is 20 cents lower. The flatbed rate is up 4 cents compared to the same week in 2021.
Spot-market demand by equipment type:
- The number of dry van load posts rose 3.8% week over week while van equipment posts decreased 4.7%. The van load-to-truck ratio was 3.8 as a national average, up from 3.5.
- The number of reefer loads jumped 6.5% and equipment posts were down 2.6%. The reefer load-to-truck ratio was 6.5, up from 6.0.
- The flatbed load count increased 5% compared to the previous week while equipment posts fell 4%. The flatbed load-to-truck ratio was 70.0 as a national average, up from 64.0
- Compared to the same period in 2021, van load-posting volumes on DAT One last week were down 17%; reefer posts were down 32%; and flatbed posts were down 14%. However, compared to 2018, van posts were up 44%; reefer posts increased 16%; and flatbed load posts were 6% higher.
Potential effects of high fuel prices on small carriers
- Contraction of small-carrier capacity as owner-operators park equipment and look for other work or take time off.
- Carriers running slower speeds and therefore covering fewer miles during a driving period.
- Carriers focusing on reducing deadhead miles.
- An increase in invoice factoring activity to improve cash flow and cover other costs.
Diesel fuel increased 74.5 cents per gallon from the weeks ending Feb. 28 to March 7, and another 40 cents to $5.25 for the week ending March 14. During those three weeks of increased fuel prices, the national average line-haul van rate fell from $2.65 to $2.43 per mile and the number of available van loads on the DAT network decreased 19%. The number of van trucks posted increased 12.5%.
Spot rates presented on the load board are “all-in” rates: a line-haul amount and a surcharge wrapped into one. For contract freight, a fuel surcharge is a separate item on the carrier invoice, making it simpler for the carrier to recover its fuel costs. Smaller carriers and owner-operators that use the spot market to find loads are more likely to pay retail price for fuel.
About the Author
FleetOwner Staff
Our Editorial Team
Kevin Jones, Editorial Director, Commercial Vehicle Group
Josh Fisher, Editor-in-Chief
Jade Brasher, Senior Editor
Jeremy Wolfe, Editor
Jenna Hume, Digital Editor
Eric Van Egeren, Art Director


