General freight rates for trucks are still down year over year, according to recent Week 15 data from both DAT Freight & Analytics and FTR Transportation Intelligence.
The data from both firms disagreed in their recorded changes for load volumes, truck posts, and rates.
However, the reports had a few areas of agreement: Both firms found that general rates were still down year over year. Both firms also agreed on general load posting volume changes for the three equipment types: Reefer loads were up week over week but down year over year; dry van loads increased both week over week and year over year; and flatbed loads declined week over week but increased year over year.
Changing load volumes, truck posts
DAT found that truck availability decreased significantly, while load posts increased slightly. FTR, however, found that load posts decreased slightly, while truck availability increased slightly.
According to DAT’s Week 15 numbers, truck posts fell significantly both week over week and year over year, particularly for reefer and van posts. Load posts saw a more moderate increase.
Truck posts on DAT One fell to 297,354, a decline of 7.1% week over week and a 34% year-over-year decline for van, reefer, and flatbed equipment. Reefer equipment truck posts for April 7-13 were at 59,992, down 6.2% week over week and down 35% year over year. Van equipment truck posts were at 197,146, down 8.2% week over week and down 35% year over year. Flatbed posts dropped to 40,216, down 1.2% week over week and down 25% year over year.
The number of load posts on DAT One was slightly higher, with 1,937,268 posts, an increase of 1.3% week over week and 4% year over year. DAT’s posts for reefer loads rose to 310,881, up 8.2% week over week but down 5% from this time last year. Van loads rose to 807,854, up 7.2% from last week and up 10% year over year. However, flatbed loads decreased to 818,533: down 5.9% from last week but up 1% from this time last year.
The drop in truck posts coincides with a continued drop in capacity for U.S. carriers, as Dean Croke, principal analyst at DAT Freight & Analytics, explains:
“Eighty-five percent of the new carriers that joined during the pandemic hit our load board as spot market carriers, so it follows that, as they exit the industry, we will see fewer trucks posting in the spot market,” Croke told FleetOwner.
Croke's theory is that, over the last six-week period, capacity leaving the market has driven DAT's noted reduction in equipment posts, while load posts remain relatively flat.
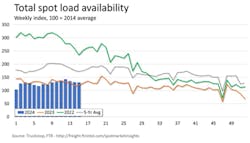
FTR found mixed developments for total spot loads. FTR’s measured total load volumes for all three equipment types declined only 0.6% from last week. This was up almost 10% from a year ago this week.
FTR’s measured refrigerated loads increased 3.7% week over week but fell 2% year over year. Dry van loads increased 4.3% from last week, rising nearly 3% this time a year ago. Flatbed loads declined 3.9% week over week but increased nearly 18% year over year.
The firms’ mixed findings for both load and truck posts led to mixed conclusions regarding load-to-truck ratios.
Mixed load-to-truck ratios
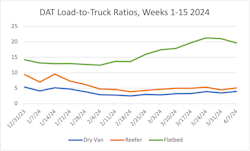
FTR’s load-to-truck ratio, also called the Market Demand Index, declined slightly as loads fell and truck postings rose. On the other hand, DAT’s measured load-to-truck ratios for vans and reefers jumped, while the ratio for flatbeds fell.
Load-to-truck ratios measure the difference between available loads and available trucks. A high load-to-truck ratio signifies greater demand for trucks, which generally fosters increased rates.
DAT’s reefer load-to-truck ratio was 5.1, up from 4.5 the previous week and from 3.7 this week last year. The van load-to-truck ratio increased to 4.0 from 3.5 the previous week and from 2.1 the year before. The load-to-truck ratio for flatbeds fell to 19.7, down from 21.1 the previous week but up from 14.8 last year.
Changes in rates
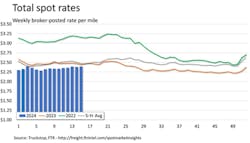
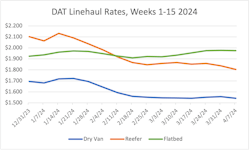
FTR found a slight increase in its total broker-posted rates, while DAT’s average linehaul rates for all three equipment types, excluding fuel surcharges, were less optimistic.
FTR’s total broker-posted rate rose slightly more than 1 cent week over week. However, rates were down 2% year over year. Reefer spot rates declined by more than 1 cent since last week but rose 1% from this time a year ago. Dry van rates increased 2.6 cents week over week, up 2.4% year over year. Flatbed rates increased 2 cents over last week, down 3% year over year.
DAT reported rates were down both from the week and year for reefer, van, and flatbed. Reefer linehaul rates averaged $1.80, down 2% week over week and down 7% year over year. Van rates averaged $1.54, down 1% from last week and down 5% from this week last year. Flatbed rates averaged $1.98, down less than 1% week over week but down 7% year over year.
“Rates tell you that there’s still too much capacity in the market,” Croke told FleetOwner. “The rates are still not behaving like you would normally see in the market. We’re still sitting for each equipment type within a penny per mile of where we were in 2019, excluding fuel.”


