Survey: Motorists say winter driving is a major stressor
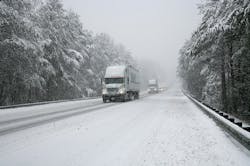
According to a new survey compiled by insurance giant Allstate, more than a third (35%) of U.S. drivers say wet winter driving “stresses them out,” while almost half (48%) are “concerned” by the prospect of driving on wet, snowy roads.
And this comes just as the National Oceanic and Atmospheric Administration (NOAA) is predicting “an especially wet winter” for much of the U.S.
While the survey found that only a quarter (26%) of American drivers feel confident in their winter driving abilities, about 92% take active steps to better prepare themselves for slick roads, including increasing following distance behind another vehicle (78%) and checking the weather before heading out (70%).
According to NOAA, such preparations are critical to safely navigate potentially harsh driving conditions.
"We share advanced seasonal outlooks to help communities prepare for what's likely to come in the next few months and minimize the winter weather's impact on lives and livelihoods," noted Mike Halpert, deputy director of NOAA's Climate Prediction Center. "Empowering people with actionable forecasts and winter weather tips is key to our effort in building a weather-ready nation."
The Allstate winter-driving survey is being released in conjunction with the company’s 2017 Allstate America's Best Drivers Report, which includes a ranking of the top 200 cities in the nation with the safest drivers when rain and snow are part of the equation.
To determine the precipitation-based rankings, Allstate said its researchers use a “predictive model” that standardizes the rankings to account for the fact that weather conditions affect road safety and vary dramatically across the U.S.
Thus, according to its algorithms, the top 10 safest-driving cities when precipitation and collisions are taken into account are:
|
City & Average Annual |
NOAA 30-Year |
Average Years |
Ranking After |
|
1. Kansas City, Kansas |
39.1 |
14.9 |
3 |
|
2. Brownsville, Texas |
27.4 |
14.5 |
4 |
|
3. Huntsville, Alabama |
54.3 |
12.4 |
33 |
|
4. Cape Coral, Florida |
55.9 |
12.2 |
17 |
|
5. Port St. Lucie, Florida |
63.7 |
12.0 |
20 |
|
6. Madison, Wisconsin |
37.3 |
12.5 |
2 |
|
7. Olathe, Kansas |
41.9 |
11.8 |
13 |
|
8. Laredo, Texas |
20.2 |
12.0 |
5 |
|
9. Boise, Idaho |
11.7 |
12.0 |
6 |
|
10. McAllen, Texas |
19.5 |
11.8 |
7 |
About the Author
Fleet Owner Staff
Our Editorial Team
Kevin Jones, Editorial Director, Commercial Vehicle Group
Cristina Commendatore, Executive Editor
Scott Achelpohl, Managing Editor
Josh Fisher, Senior Editor
Catharine Conway, Digital Editor
Eric Van Egeren, Art Director