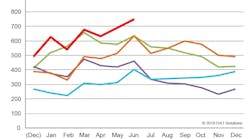
Demand for truckload shipments faced off against capacity shortfalls, boosting truckload rates to new heights on the spot market in June, according to DAT Solutions, which operates North America’s largest load board marketplace.
Rates for spot market transactions matched longer-term contract rates for dry van equipment, while spot refrigerated (“reefer”) and flatbed rates exceeded contract rates as a national average.
“June capped an unprecedented 15-month run of spot market rate increases, the longest sustained period of pricing power for truckers since deregulation,” said Mark Montague, pricing analyst at DAT.
“While contract rates typically rise after a sustained increase in spot market rates, there is usually a lag of four to six months. This year, that lag time is reduced to a few weeks,” Montague explained.
Contract rates increased 19% for vans compared to June 2017, but spot market rates rose by 29% during the same period.
Spot van rates hit $2.32 per mile, and rates paid to carriers by freight intermediaries matched the longer-term contract rates paid by shippers directly to carriers.
Spot reefer and flatbed rates both exceeded the comparable contract rates, as reefer rates rose 16 cents to $2.69 and flatbeds added 10 cents to $2.82, compared to the national averages for May.
Compared to June 2017, spot van rates soared 52 cents per mile, reefers surged 58 cents and flatbeds shot up 65 cents.
Freight availability on DAT load boards also set a new record, as the DAT North American Freight Index rose 9.3% month over month, and increased 18% compared to June 2017.
Established in 1978, DAT operates a network of load boards serving intermediaries and carriers across North America. For more than a decade DAT has published its Freight Index, which is representative of the dynamic spot market.
Referenced rates are the averages by equipment type, based on $57 billion of actual transactions, as recorded in DAT RateView. Reference rates per mile include fuel surcharges, but not accessorials or other fees. The DAT Freight Index reflects load posting volume on the DAT network of load boards, and 100 on the Index represents the average monthly volume in the year 2000. Additional trends and analysis are available at DAT Trendlines.


