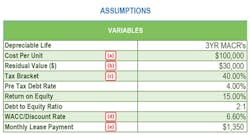
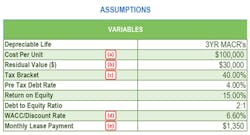
An invaluable financial tool used to analyze whether it is more advantageous to purchase or lease tractor equipment is an analysis commonly known as a ‘Lease vs. Buy’ analysis. What follows, is a step-by-step illustration and explanation of that analysis. In the illustration, the alpha notations in ‘Assumptions’ correspond to the variables in the exhibits that follow.
Assuming that the equipment cost and usage terms are the same, the three primary factors that affect the results of a Lease vs. Buy analysis are:
- Residual Value (RV)
- Income Tax Rate
- Weighted Average Cost of Capital (WACC or Discount Rate)
The most widely accepted format is to calculate the Net Present Value of the tractor purchase (discounted after-tax including its associated depreciation tax benefits), and compare that to the after-tax cash flow payments of a ‘walk-away’ lease (a walk-away lease presents no residual risk to the user at expiration).
The tractor’s residual (resale) value has the single largest effect on the analysis, followed by the after-tax cost of capital (discount rate) and the combined federal and state income tax rates of the buyer (or lessee).
Tax Benefits:
An over-the-road tractor qualifies for accelerated depreciation tax benefits (Year 1 @ 33.33%; Year 2 @ 44.45%; Year 3 @ 14.81% and Year 4 @ 7.41%). Because tax filings are due on a quarterly basis, depreciation is fully utilized in 39 months. The accelerated depreciation benefit illustrated below assumes that the tractor purchase takes place at the end of December and the tax reporting is on a calendar year. The buyer is entitled to a 33.33% depreciation expense allowance (calculated on the tractor’s initial purchase price including applicable taxes (‘its cost basis’)) as a tax deduction—an overly simplified example. Using the Year 1 depreciation benefit of 33.33% and the 40% tax bracket (c), results in a 13.33% cash flow savings (33.33% X 40% = 13.33%). Since the tractor cost is $100,000 (a), the buyer saves $13,300 on his quarterly tax bill immediately upon purchase. This is equivalent to receiving an interest-free loan from the government that essentially reduces the cash invested in the tractor from $100,000 to $86,700.
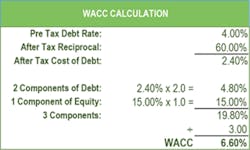
Here’s how the math works: Take the average cost of debt and convert it to an after-tax basis. This illustration assumes a pre-tax debt of 4.00%, a 2.40% after-tax cost of debt (4.00% less a 40.00% tax rate (c)) and an ROE (which is always after-tax) of 15.00%. If the debt-to-equity ratio is 2 to 1, the WACC is calculated by using two components of debt to one component of equity. ie: There are two components of debt equaling 4.80% (2 X the after-tax debt of 2.40% or 4.80%) plus the 1 component of equity (15.00%) for a combined total of 19.80%, divided by 3 (2 debt components and 1 equity component), which equals an after-tax discount rate of 6.60%.
Residual Value:
The residual value factor is the most critical to the analysis. In a purchase scenario, every $1,000 of gain or loss at expiration affects the after-tax net present value outcome by $436. It is important to note that the residual (resale) value must be calculated on an after-tax basis. It is a common error in this analysis to overlook this detail. Having taken the tractor’s tax depreciation to zero, the buyer will incur a taxable gain on its resale proceeds.
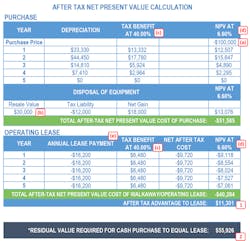
The analysis is depicted in the following table:
The net present value of the after-tax cost to purchase this tractor is $51,585, whereas the net present value of the after-tax cost to lease the same tractor is $40,284. In this example, leasing provides a clear financial advantage by lowering the after-tax cost by $11,301 (1).
Looking at the analysis from a different angle, you can calculate the residual (resale) value necessary to reach a breakeven point between a cash purchase and lease. To achieve the same financial benefit as leasing, the tractor requires a residual (resale) value of $55,926 (2) at the end of five years, rather than the more realistic $30,000 as estimated in the illustration. Even in today’s strong resale market, the probability of selling a five year old tractor for $55,926 is highly unlikely. However, it serves to highlight a fundamental advantage of a walk-away lease, which transfers the residual (resale) risk from the buyer to the lessor. At the end of the lease term, the lessee returns the tractor to the lessor and walks away with no responsibility to sell the tractor for its required residual (resale) value.
Although the calculations can be somewhat difficult at first, the Purchase/Lease Analysis is an invaluable financial tool that can help you determine the most cost-effective method for acquiring equipment.
About the Author
John Flynn
CEO
John Flynn is CEO of Fleet Advantage and he has enjoyed an extensive and productive career in the Class-8 truck industry that spans over 30 years. Under Flynn’s leadership, Fleet Advantage guarantees the absolute lowest cost of ownership for America's corporate fleets by matching proprietary IT processes and fleet analytics with the latest eco-efficient clean diesel technology to achieve the optimum vehicle lifecycle and maximum productivity, while achieving fuel economy and sustainability goals.


