After a chilly start to 2019, spot truckload volumes and rates look like they’re starting to thaw.
The number of load posts on the DAT network of load boards climbed 4% while truck posts fell 2% during the week ending Feb. 16.
Reefers remain in a seasonal decline but volumes rose and capacity tightened for vans and flatbeds, which elevated load-to-truck ratios in both segments:
- Van L/T ratio: 4.8, up 4%
- Flatbed LT ratio: 27, up 12%
- Reefer L/T ratio: 5.8, down 1%
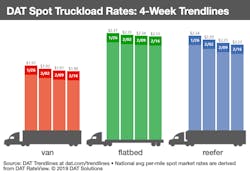
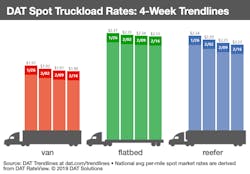
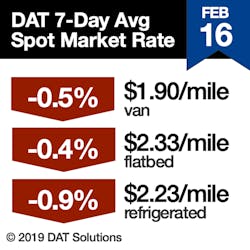
National average spot rates slipped but remain solid compared to previous years:
- Van: $1.90/mile, down 1 cent
- Flatbed: $2.33/mile, down 1 cent
- Reefer: $2.23/mile, down 2 cents
Van trends
Spot volumes firm up: Van load posts increased 2% while truck posts fell 2%. Van volumes appear to be firming up about a month ahead of schedule.
Van rates in balance: Rates rose on 47 of the top 100 van lanes last week and drifted lower on 40. Rates were unchanged on the remaining 13 lanes; that’s a big number and a signal that rates are at or near the bottom for winter.
Weather and rates: For an example of how weather affects rates, look at Seattle to Spokane. Snow and ice periodically shut down I-90 last week, and Seattle to Spokane — a typically weak lane — jumped 31 cents to an average of $3.54/mile.
Flatbed trends
Volumes build ahead of construction season: The number of flatbed load posts was up 7% last week while truck posts dropped 5%, a sign that seasonal construction activity is picking up.
Reefer trends
Will weak reefer markets affect van freight? The spot reefer market saw load posts fall 1% and truck posts hold steady last week. The downward trend may affect van capacity, as reefer haulers sometimes turn to spot van freight during lulls in the market.
DAT Trendlines are generated using DAT RateView, which provides real-time reports on spot market and contract rates, as well as historical rate and capacity trends. The RateView database is comprised of more than $60 billion in freight payments.
DAT load boards average 1.2 million load posts searched per business day.
About the Author
Fleet Owner Staff
Our Editorial Team
Kevin Jones, Editorial Director, Commercial Vehicle Group
Cristina Commendatore, Executive Editor
Scott Achelpohl, Managing Editor
Josh Fisher, Senior Editor
Catharine Conway, Digital Editor
Eric Van Egeren, Art Director


