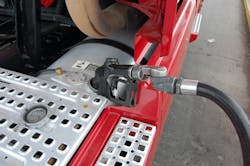
Retail pump prices for diesel jumped up in all regions of the U.S. this week while gasoline prices dropped in all but two regions of the nation, according to data tracked by the Energy Information Administration (EIA). That being said, though, the agency noted both diesel and gasoline are far more costly now compared to the same time period in 2012.
EIA reported that the average U.S. retail pump price for diesel increased 1.2 cents to $3.915 per gallon, which is 11.9 cents per gallon more expensive compared to the same week in 2012. Diesel prices were up in every region of the country, exceeding the $4 per gallon mark in New England ($4.061), the West Coast ($4.052) and California ($4.122).
The agency added that retail pump prices underwent the biggest weekly jump in the Rocky Mountain region, rising 4.7 cents to $3.913 per gallon, which is 18.4 cents more per gallon compared to the same time period last year.
Retail pump prices for gasoline, by contrast, declined in all but two regions of the U.S. this week, EIA said, falling by a national average of 3.6 cents to $3.646 per gallon – though that is 13.8 cents per gallon more expensive compared to the same week in 20102, the agency stressed.
Gasoline prices only increased in California and the Rocky Mountain region, rising 2.2 cents to $3.738 per gallon and 2.4 cents to $3.64 per gallon, respectively, EIA noted.
On a side note, the agency indicated a recently released Refinery Capacity Report that an interesting transportation trend is developing where domestic crude oil shipments are concerned: the use of rail, truck, and barge to deliver crude oil to refineries is on the rise, in part due to increases in U.S. crude oil production.
In particular, the Gulf Coast (PADD 3) region accounts for most U.S. refinery receipts by rail, truck, and barge, EIA stated, where usage of those modes nearly doubled in 2012 as that area is increasingly dependent on rail and truck to move crude production out of the Eagle Ford and Permian basins to refineries in the area until pipelines are built.
In the Rocky Mountain region (PADD 4), domestic truck and pipeline imports of Canadian oil continue to increase as domestic pipeline receipts have stayed flat, while East Coast (PADD 1) receipts by rail, truck, and barge reversed a decrease in 2011 in part driven by refinery closures by jumping 18% in 2012 as a number of refiners put in rail facilities to receive discounted crude from the Bakken and other tight oil formations.
While refinery receipts of crude by truck, rail, and barge remain a small percentage of total receipts, EIA said its recent data indicates refineries across the nation received more than 1 million barrels per day (bbl/d) by rail, truck, and barge in 2012 – a 57% increase from 2011. Total refinery receipts of crude oil run about 15.2 million barrels per day (bbl/d), with more than half of that crude oil arriving by pipeline, the agency added.
“Truck and rail provide an alternative transportation method when pipelines are operating at capacity or when a production area lacks pipeline infrastructure,” EIA said in its report.
“Both offer greater operational flexibility than pipelines as they make use of existing road and rail infrastructure near producing basins to move crude oil to refineries that may not be accessible by pipelines,” the agency noted. “The increase in barge receipts may partially be explained by crude oil being transferred to barges from rail cars for the final leg of some journeys to refineries, particularly on the East Coast and along the Mississippi River. [But] even as additional pipeline infrastructure is put in place, crude oil is expected to continue moving by rail and truck as economics dictate.”
About the Author
Sean Kilcarr
Editor in Chief
Sean Kilcarr is a former longtime FleetOwner senior editor who wrote for the publication from 2000 to 2018. He served as editor-in-chief from 2017 to 2018.
