Global oil prices fell sharply in the fourth quarter of 2014, according to data tracked by the Energy Information Administration (EIA) as robust global production exceeded demand. That’s also helping U.S. fuel prices remain on a downward slope, the agency noted.
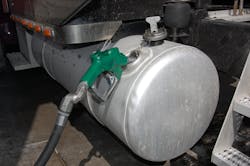
The average retail pump price for diesel in the U.S. dropped 7.6 cents this week to $3.137 per gallon, EIA reported – which is 77.3 cents per gallon cheaper compared to the same week in 2014.
Diesel prices dropped the most in the Midwest and Rocky Mountains this week, falling 10.4 cents to $3.102 and 10 cents to $3.139, respectively. The Gulf Coast is home to the cheapest diesel in the nation this week at $3.045, down 7.6 cents per gallon compared to last week, the agency noted.
The average retail pump price for gasoline in the U.S. declined 8.5 cents to $2.214 per gallon this week, which is $1.118 per gallon cheaper compared to the same week in 2014, EIA said.
Gasoline prices dropped the most in the Midwest and the Rocky Mountains, falling 1.4 cents in each region to $1.9754 and $2.582, respectively – with the Midwest’s average price for gasoline the cheapest in the U.S., the agency reported.
The Gulf Coast, where prices decreased 8 cents this week to $1.993 per gallon, is the only other region in country where gasoline prices dropped under the $2 per gallon mark, EIA added.
Current and future fuel prices declines are pegged to the rapid decrease in global prices that started in the summer last year, the agency pointed out.
After reaching monthly peaks of $112 per barrel (bbl) and $105/bbl in June 2014, crude oil benchmarks Brent and West Texas Intermediate (WTI) fell to $62/bbl and $59/bbl in December, respectively.
Brent prices fell below the five-year average in early September and slipped well below the five-year range in November and December. WTI prices have been below the five-year average since early October and below the five year-range since early November.
Other crude oil trends worth noting:
- Domestic crude oil production in the U.S. increased 1.2 million barrels per day (bbl/d) in 2014, up 16% from 2013. At 8.6 million bbl/d, U.S. production is at the highest level in nearly 30 years.
- The Brent-WTI spread averaged less than $6/bbl, significantly lower than the 2011-13 average of nearly $15/bbl.
- Estimated global liquids production grew by 1.8 million bbl/d to total 92.0 million bbl/d in 2014, mainly reflecting non-OPEC (Organization of the Petroleum Exporting Countries) production increases concentrated in North America.
- EIA estimates that global unplanned supply disruptions averaged 3.1 million bbl/d in 2014, 0.4 million bbl/d higher than the previous year. OPEC producers had the largest share of outages at 2.5 million bbl/d.
- EIA estimates that global liquid fuels production exceeded consumption in each of the four quarters of 2014. In the previous five years, production had not exceeded consumption for more than two consecutive quarters.
About the Author
Sean Kilcarr
Editor in Chief
Sean Kilcarr is a former longtime FleetOwner senior editor who wrote for the publication from 2000 to 2018. He served as editor-in-chief from 2017 to 2018.
