By the numbers: Key trucking indicators reported this week
Feb. 27, 2015
5 min read

Truckload measure up 7.9%, rates to climb
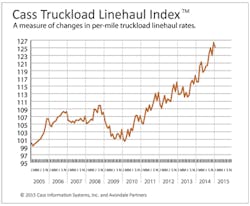
In January, the Cass Truckload Linehaul Index rose 7.9% year over year. With demand improving and capacity remaining extraordinarily tight, contract rate increases should continue to filter into our index at higher levels, the report notes.
“We see TL pricing increasing between 4% and 9% in 2015, depending on how much rate increase each carrier was successful in obtaining in 2014 and when those rate increases were achieved,” said the commentary from investment firm Avondale Partners.
The Cass Truckload Linehaul Index is a measure of market fluctuations in per-mile truckload linehaul rates, independent of additional cost components such as fuel and accessorials.ATA tonnage index hits all time highAmerican Trucking Associations’ advanced seasonally adjusted For-Hire Truck Tonnage Index increased 1.2% in January, following a revised gain of 0.1% during the previous month. In January, the index equaled 135.7 (2000=100), an all-time high.
Compared with January 2014, the SA index increased 6.6%, which was the largest year-over-year gain in over a year.
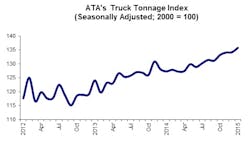
The not seasonally adjusted index, which represents the change in tonnage actually hauled by the fleets before any seasonal adjustment, equaled 126.9 in January which was 3.5% below the previous month (131.5).
ATA recently revised the seasonally adjusted index back five years as part of its annual revision. For all of 2014, tonnage was up 3.7%, slightly better than the 3.4% originally reported. In 2013, the index increased 5.5%.
“Truck tonnage continued to improve in January, marking the fourth straight gain totaling 3.5%,” said ATA Chief Economist Bob Costello. “Last year was slightly better for truck tonnage than we originally thought and I am expecting that momentum to continue in 2015.”
Costello added that since bottoming out in March 2014, tonnage is up 6.7%.Intermodal traffic slumps, off 15.7%
For the week ending Feb. 21, total U.S. weekly rail traffic was 473,161 carloads and intermodal units, down 11.5% compared with the same week last year, the Association of American Railroads (AAR) reported.
Total carloads for the week were 259,544 carloads, down 7.8% compared with the same week in 2014, while U.S. weekly intermodal volume was 213,617 containers and trailers, down 15.7% compared to 2014.
Grain was the lone commodity group to post an increase compared with the same week in 2014, up 4% to 22,877 carloads. Commodity groups that saw decreases during this one week included: motor vehicles and parts, down 12.2% to 14,980 carloads, coal, down 12% to 96,096 carloads and metallic ores and metals, down 9.2% to 20,235 carloads.
For the first seven weeks of 2015, U.S. railroads reported carloads were up 3.7%from the same point last year, and intermodal was down 2.3%. Total combined U.S. traffic was 3,675,857 carloads and intermodal units, up 0.8 percent from last year.
NAFTA: Cross-border truck freight surges 9.3%
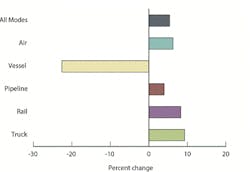
U.S.-NAFTA freight totaled $95.8 billion in December 2014 as four out of five transportation modes – truck, rail, air, and pipeline – carried more U.S.-NAFTA freight than in December 2013, according to data from the U.S. Department of Transportation’s Bureau of Transportation Statistics (BTS).
Year-over-year, the value of U.S.-NAFTA freight flows by all modes increased by 5.4 percent, with December marking the 11thconsecutive month of year-over-year increases.
The value of commodities moving by truck grew by the largest percentage of any mode, 9.3 percent. Rail freight increased by 8.3 percent, air rose by 6.3 percent, and pipeline grew by 4.0 percent. Vessel freight decreased by 22.6 percent, mainly due to lower mineral fuel prices.
Trucks carried 59.2 percent of U.S.-NAFTA freight and were the most heavily utilized mode for moving goods to and from both U.S.-NAFTA partners. Trucks accounted for $28.4 billion of the $52.5 billion of imports (54.0 percent) and $28.4 billion of the $43.3 billion of exports (65.6 percent).Trailer orders slip in January
Trailer net orders in January, at 19,853, were down nearly 32% from December’s very strong order volume, but rose 18% year over year, according to the most recent State of the Industry: U.S. Trailers published by ACT Research Co. (ACT).
“Total trailer backlog is at its highest level in almost 20 years,” said Frank Maly, Director – CV Transportation Analysis and Research at ACT. “Part of January’s strength resulted from some ‘out-of-pattern’ orders as fleets are getting in queue for equipment.”
Maly noted that, with ratification of the West Coast port contract proposal likely, the economy has side-stepped significant headwinds. He said ensuing freight onslaught will be a net positive for the commercial vehicle industry.
“Trailer demand continues to receive support from a wide array of factors, including solid freight volumes, pent-up demand for replacement equipment, and increased consumer and business spending. The foundation is in place for 2015 to be the best trailer market since the late 1990s.”
About the Author
Sign up for our eNewsletters
Get the latest news and updates