AT Money Roll: Trucks carry 60% of cross-border trade in 2014
The week’s roundup of economic reports and trucking trends includes the DOT wrap up of 2014 cross-border trade (+4.5%), the latest weekly rail traffic report (-3.5%), home construction (-17%), industrial production (+0.1%), and leading indicators (+0.2%).
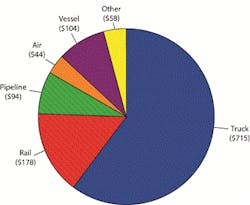
Trucks carried 59.9 percent of U.S.-NAFTA freight and were the most heavily utilized mode for moving goods to and from both U.S.-NAFTA partners. Trucks accounted for $348.7 billion of the $640.2 billion of imports (54.5 percent) and $365.9 billion of the $552.5 billion of exports (66.2 percent).
Although trucks carry almost three-fifths of U.S.-NAFTA freight, its share has decreased by 3.7 percentage points from 2004, the first year of BTS data for all modes.
Rail Intermodal: Total U.S. carloads for the week ending Mar. 14 were down 3.5 percent compared with the same week in 2014, while U.S. weekly intermodal volume was up 7 percent, the Assn. of American Railroads (AAR) reports.
Two of the 10 carload commodity groups posted increases compared with the same week in 2014. They were: grain, up 7.8 percent, and miscellaneous carloads, up 16.7 percent.
Commodity groups that saw decreases during this one week included petroleum and petroleum producers, down 11.1 percent; metallic ores and metals, down 7.8 percent; and nonmetallic minerals, down 6.4 percent to 31,724 carloads.
For the first 10 weeks of 2015, U.S. railroads reported cumulative volume of 2.8 million carloads, up 1.2 percent from the same point last year; and 2.46 million units, down 1.1 percent.
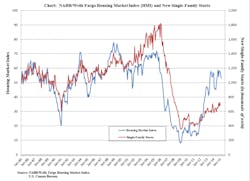
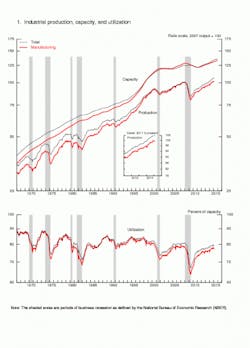
Home construction: Nationwide housing starts dropped 17 percent to a seasonally adjusted annual rate of 897,000 units in February, according to newly released data from the U.S. Commerce Department and the National Assn. of Home Builders.Industrial production: Industrial production increased 0.1 percent in February after decreasing 0.3 percent in January, according to data from the Federal Reserve. Manufacturing output moved down 0.2 percent, its third consecutive monthly decline.
The index for mining fell 2.5 percent in February; drops in the indexes for coal mining and for oil and gas well drilling and servicing primarily accounted for the decrease. The output of utilities jumped 7.3 percent, as especially cold temperatures drove up demand for heating.
At 105.8 percent of its 2007 average, total industrial production in February was 3.5 percent above its level of a year earlier. Capacity utilization for the industrial sector decreased to 78.9 percent in February, a rate that is 1.2 percentage points below its long-run (1972–2014) average.
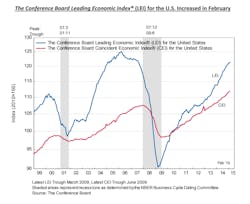
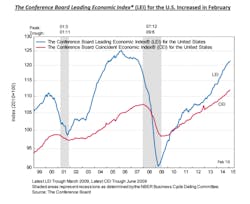
Leading indicators: The Conference Board Leading Economic Index (LEI) for the U.S. increased 0.2 percent in February to 121.4 (2010 = 100), following a 0.2 percent increase in January, and a 0.4 percent increase in December.
“Widespread gains among the leading indicators continue to point to short-term growth,” said Ataman Ozyildirim, economist at The Conference Board. “However, easing in the LEI’s six-month change suggests that we may be entering a period of more moderate expansion. With the February increase, the LEI remains in growth territory, but weakness in the industrial sector and business investment is holding economic growth back, despite improvements in labor markets and consumer confidence.”The CEI increased 0.2 percent in February to 111.9 (2010 = 100), following a 0.2 percent increase in January, and a 0.3 percent increase in December.
The Conference Board Lagging Economic Index (LAG) for the U.S. increased 0.3 percent in February to 115.8 (2010 = 100), following a 0.3 percent increase in January, and a 0.2 percent increase in December.
About the Author
Kevin Jones
Editor
Kevin has served as editor-in-chief of Trailer/Body Builders magazine since 2017—just the third editor in the magazine’s 60 years. He is also editorial director for Endeavor Business Media’s Commercial Vehicle group, which includes FleetOwner, Bulk Transporter, Refrigerated Transporter, American Trucker, and Fleet Maintenance magazines and websites.
Working from Beaufort, S.C., Kevin has covered trucking and manufacturing for nearly 20 years. His writing and commentary about the trucking industry and, previously, business and government, has been recognized with numerous state, regional, and national journalism awards.
