Trucker 539 Reefer 2

Spot market update: Spring produce drives reefer demand

March 16, 2016
The top lanes for spot refrigerated truckload freight saw a 10% increase in volume during the week ending March 12, reports DAT Solutions, which operates the DAT network of load boards. Reefer rates are trending up in California, Texas, and Florida—all key states for produce.
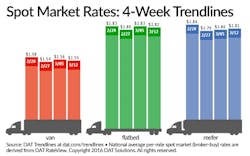
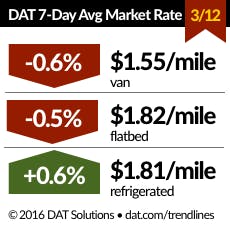
The top lanes for spot refrigerated truckload freight saw a 10% increase in volume during the week ending March 12, reports DAT Solutions, which operates the DAT network of load boards. Reefer rates are trending up in California, Texas, and Florida—all key states for produce. The national average reefer rate edged up 1 cent to $1.81 per mile compared to the previous week and the number of reefer load posts fell 2% while truck posts were unchanged. The load-to-truck ratio dropped 2.5% from 3.1 to 3.0 loads per truck, meaning there were 3.0 refrigerated loads for every truck posted on the DAT network.

Rising markets for spot reefer freight included Los Angeles, up 7 cents to $2.30 per mile; McAllen, Texas, up 5 cents to $1.86 per mile; and Lakeland, Fla., up 3 cents to an average of $1.31 per mile. 

Van load posts, however, declined 5% and truck posts increased 1%, causing the van load-to-truck ratio to fall 7% from 1.6 to 1.5 loads per truck. The national average van rate dipped 1 cent to $1.55 per mile.

Flatbed load volume rose 4% and capacity declined 5%, increasing the load-to-truck ratio 9% to 16.1. The national average flatbed rate dropped 1 cent to $1.82 per mile. Regionally, spot flatbed freight was strongest in the Southeastern U.S.

Across all three equipment types, the number of available loads and capacity on the spot market was virtually unchanged compared to the previous week.

The national average diesel price rose 8 cents to $2.10 a gallon. The increase led to 1-cent gain in fuel surcharges for vans and flatbeds.

Rates are derived from DAT RateView, which provides real-time reports on prevailing spot market and contract rates, as well as historical rate and capacity trends. All reported rates include fuel surcharges.

Load-to-truck ratios represent the number of loads posted for every truck available on DAT load boards. The load-to-truck ratio is a sensitive, real-time indicator of the balance between spot market demand and capacity. Changes in the ratio often signal impending changes in rates, DAT notes.

Voice your opinion!

To join the conversation, and become an exclusive member of FleetOwner, create an account today!

Sponsored Recommendations

Boost truck leasing profits with telematics insights! Reduce maintenance costs, improve uptime, and strengthen customer relationships. Learn how data drives success.
This free guide outlines simple steps for hiring and onboarding commercial drivers while ensuring that you meet Regulation Part 391 and maintain fully compliant driver qualification...
Ready to boost fleet efficiency by up to 50%? Learn how AI-powered dispatch and next-gen tech are transforming TMS workflows, improving driver planning, and streamlining operations...
Gain a strategic edge in today’s evolving fleet landscape. Join us to explore how fuel cards are helping fleet managers cut costs, enhance control, and prepare for an electrified...