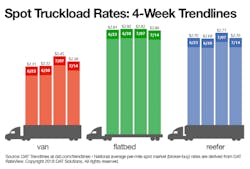
Spot truckload freight rates stepped down from their record highs during the week ending July 14, potentially marking the start of a seasonal transition to less intense demand by shippers.
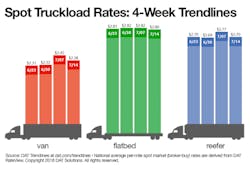
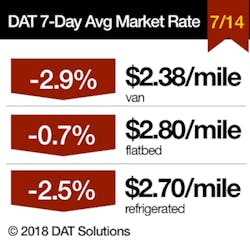
The national average spot van rate on the DAT network of load boards fell 7 cents to $2.38/mile while the refrigerated rate dropped 7 cents to $2.70/mile. After holding steady for two weeks, the flatbed rate dipped 2 cents to $2.80/mile.
Load-to-truck ratios declined for all three equipment types, a sign that recent capacity constraints are beginning to loosen. The overall number of loads posted on DAT load boards increased 18% last week and capacity increased 21%; gains of 20% to 25% are more typical when comparing a full workweek to one shortened by a holiday.
Van overview: The number of van load posts on DAT load boards increased 14% last week but truck posts increased 21% as brokers and carriers stepped up their activity. The capacity influx had a stabilizing effect on prices and caused the weekly van load-to-truck ratio to dip to 7.3 loads per truck. In DAT’s top 100 van lanes for spot van freight volume last week, 81 lanes moved lower and only 14 lanes moved higher, with five lanes neutral.
Flatbed overview: The national load-to-truck ratio for flatbeds fell for the fifth week in a row, down to 48.4 loads per truck. That's still high but less than half the early-June level of 109 loads per truck. Last week there was a 25% increase in flatbed load posts and a 36% increase in truck posts on DAT load boards, in line with expectations for the first full week after a holiday.
Reefer overview: The number of reefer load posts on DAT load boards increased 11% while truck posts gained 16%. That caused the load-to-truck ratio to fall from 9.3 to 8.9 reefer loads per truck. While the market for general-commodity refrigerated freight remains firm, there isn't the same push from produce shippers this summer. Several key regions are subpar in terms of available freight, including the Central Valley in California. Many of the stronger areas last week — Salinas, CA; Grand Rapids, MI; New Jersey; and New Mexico — are not considered high-volume markets.
DAT Trendlines is generated using DAT RateView, a service that provides real-time reports on prevailing spot market and contract rates, as well as historical rate and capacity trends. RateView's comprehensive database is comprised of more than $45 billion in freight bills in over 65,000 lanes. DAT load boards average 993,000 load posts per business day.
About the Author
Fleet Owner Staff
Our Editorial Team
Kevin Jones, Editorial Director, Commercial Vehicle Group
Cristina Commendatore, Executive Editor
Scott Achelpohl, Managing Editor
Josh Fisher, Senior Editor
Catharine Conway, Digital Editor
Eric Van Egeren, Art Director


