Historically tight truckload capacity is easing in July: DAT
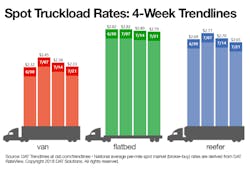
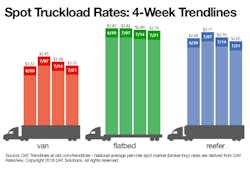
Spot truckload rates continued their seasonal decline during the week ending July 21 as the overall number of loads posted on DAT load boards fell 5.5% and capacity increased by 1.3%.
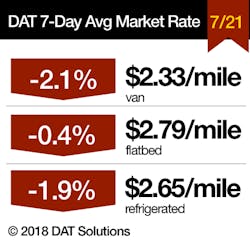
National average rates declined for all three equipment types: the van rate fell 5 cents to $2.33/mile, the refrigerated rate dropped 5 cents to $2.70/mile, and the flatbed rate edged down 1 cent to $2.79/mile. Load-to-truck ratios also declined, a sign that historically tight truckload capacity is easing.
Van overview: Van truck posts were up 2% compared to the previous week while the number of available van loads was virtually unchanged. The national van load-to-truck ratio fell slightly to 7.1.
The sharpest drops in average outbound van rates were in the Southeast:
- Atlanta: $2.60/mile, down 20 cents
- Memphis: $2.90/mile, down 11 cents although load-to-truck ratios remained healthy
- Charlotte: $2.72, down 15 cents
Several van lanes reflected this regional trend:
- Atlanta to Charlotte: $3.15/mile, down 45 cents
- Memphis to Charlotte: $2.65/mile, down 26 cents
- Atlanta to Chicago: $2.12/mile, down 25 cents
Overall, rates moved higher on just 18 of DAT's Top 100 lanes. Seventy-six lanes were lower and six were neutral.
Flatbed overview: The national load-to-truck ratio for flatbeds fell for the sixth week in a row. Load posts were down 11% while truck posts were up 1%, which pushed the ratio down to 43 loads per truck. That’s roughly half the June average.
DAT Trendlines is generated using DAT RateView, an innovative service that provides real-time reports on prevailing spot market and contract rates, as well as historical rate and capacity trends. RateView's comprehensive database is comprised of more than $45 billion in freight bills in over 65,000 lanes. DAT load boards average 993,000 load posts per business day.
About the Author
Fleet Owner Staff
Our Editorial Team
Kevin Jones, Editorial Director, Commercial Vehicle Group
Cristina Commendatore, Executive Editor
Scott Achelpohl, Managing Editor
Josh Fisher, Senior Editor
Catharine Conway, Digital Editor
Eric Van Egeren, Art Director


