Surging imports at West Coast ports helped push spot load-to-truck ratios higher for van and refrigerated freight during the week ending Nov. 3, according to data tracked by DAT Solutions, which operates the DAT network of load boards.
The demand for trucks, combined with lower fuel prices, helped slow recent declines in the national average spot van rate. However, national averages for reefer and flatbed freight continued to drift lower despite tighter capacity.
National average load-to-truck ratios:
- Van freight: 5.2 loads per truck, up 10% compared to the previous week
- Refrigerated freight: 6.8 loads per truck, up 11%
- Flatbed freight: 17.0 loads per truck, down 1.5%, in line with seasonal expectations
National average spot truckload rates:
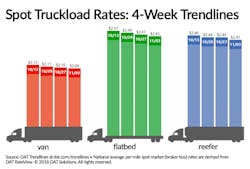
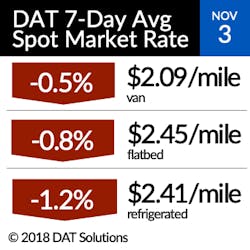
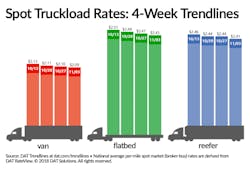
- Van: $2.09/mile, down 1 cent compared to the previous week
- Reefer: $2.41/mile, down 3 cents
- Flatbed: $2.45/mile, down 2 cents
Van trendlines: The number of van load posts on DAT load boards jumped up 7% while truck posts dropped 4% last week. Rates were higher on 39 of the top 100 van lanes; 56 lanes were lower and five were neutral.
Los Angeles ($2.66/mile average, up 7 cents) keeps driving demand. The load-to-truck ratio was 12.2 last Friday and rates on two outbound lanes were especially strong: Los Angeles to Dallas ($2.51/mile) and Los Angeles to Denver ($3.21/mile) were both up 14 cents compared to the previous week.
Atlanta ($2.22/mile average, down 2 cents) may be the next market to reverse course, as volumes were lower compared to the previous week but firming up. Van demand and rates were lower virtually everywhere else.
Reefer trendlines: The number of reefer load posts rose 6% while truck posts fell 4% nationally on the cusp of heavier shipping demand for holiday produce.
However, spot reefer rates were neutral in many major markets, including McAllen, TX ($2.17/mile, up 3 cents), Los Angeles ($3.05/mile, unchanged), and Chicago ($2.98/mile, down 1 cent), and lower in Grand Rapids ($3.37/mile, down 10 cents), Philadelphia ($3.01/mile, down 9 cents), and Elizabeth, NJ ($2.22/mile, down 4 cents).
Twin Falls, ID, to Baltimore gained 21 cents $2.54/mile, an indicator of long-haul reefer rates.
Flatbed Trendlines: Flatbed activity on DAT load boards slowed last week, typical of this time of year. Load posts fell by 4%, while truck posts decreased 3%.
Fuel: The price of diesel fell 1 cent to $3.34/gallon compared to the previous week. Spot rates include a fuel surcharge portion.
DAT Trendlines are generated using DAT RateView, which provides real-time reports on spot market and contract rates, as well as historical rate and capacity trends. RateView's database is comprised of more than $57 billion in freight payments. DAT load boards average 1 million load posts per business day.
About the Author
Fleet Owner Staff
Our Editorial Team
Kevin Jones, Editorial Director, Commercial Vehicle Group
Cristina Commendatore, Executive Editor
Scott Achelpohl, Managing Editor
Josh Fisher, Senior Editor
Catharine Conway, Digital Editor
Eric Van Egeren, Art Director


