ATA
1.22.19 ATA truck tonnage.png

ATA Truck Tonnage Index increased 6.6% in 2018

Jan. 23, 2019
December Index 4.3% lower than November.

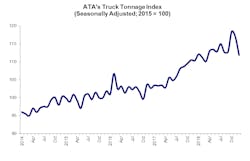
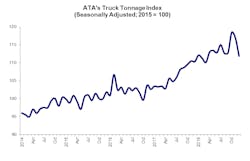
American Trucking Associations’ advanced seasonally adjusted (SA) For-Hire Truck Tonnage Index increased 6.6% in all of 2018 – the largest annual gain since 1998 (10.1%) and significantly better than the 3.8% increase in 2017.

That annual gain was realized despite a decrease of 4.3% in December to 111.9, down from November’s level of 116.9.

“The good news is that 2018 was a banner year for truck tonnage, witnessing the largest annual increase we’ve seen in two decades,” said ATA Chief Economist Bob Costello. “With that said, there is evidence that the industry and economy is moderating as tonnage fell a combined total of 5.6% in October and November after hitting an all-time high in October.”

November’s change over the previous month was revised down to -1.3% (+0.4% was originally reported in our press release on December 18).

Compared with December 2017, the SA index increased 1.4%, the smallest year-over-year increase in 2018. In November, the index was 5.8% above the same month in 2017. The not seasonally adjusted index, which represents the change in tonnage actually hauled by the fleets before any seasonal adjustment, equaled 107.8 in December, which was 7.8% below the previous month (117). In calculating the index, 100 represents 2015. Trucking serves as a barometer of the U.S. economy, representing 70.2% of tonnage carried by all modes of domestic freight transportation, including manufactured and retail goods. Trucks hauled 10.77 billion tons of freight in 2017. Motor carriers collected $700.1 billion, or 79.3% of total revenue earned by all transport modes. ATA calculates the tonnage index based on surveys from its membership and has been doing so since the 1970s. This is a preliminary figure and subject to change in the final report issued around the 10th day of the month. The report includes month-to-month and year-over-year results, relevant economic comparisons and key financial indicators.  

About the Author

Fleet Owner Staff

Our Editorial Team

Kevin Jones, Editorial Director, Commercial Vehicle Group

Cristina Commendatore, Executive Editor

Scott Achelpohl, Managing Editor 

Josh Fisher, Senior Editor

Catharine Conway, Digital Editor

Eric Van Egeren, Art Director
Voice your opinion!

To join the conversation, and become an exclusive member of FleetOwner, create an account today!

Sponsored Recommendations

Uniting for Bold Solutions to Tackle Transportation’s Biggest Challenges

Over 300 leaders in transportation, logistics, and distribution gathered at Ignite 2024. From new products to innovative solutions, Ignite highlighted the importance of strong...

Seasonal Strategies for Maintaining a Safe & Efficient Fleet Year-Round

Prepare your fleet for every season! From winterizing vehicles to summer heat safety, our eBook covers essential strategies for year-round fleet safety. Download now to reduce...

Streamline Compliance, Ensure Safety and Maximize Driver's Time

Truck weight isn’t the first thing that comes to mind when considering operational efficiency, hours-of-service regulations, and safety ratings, but it can affect all three.

Improve Safety and Reduce Risk with Data from Route Scores

Route Scores help fleets navigate the risk factors they encounter in the lanes they travel, helping to keep costs down.