For Mike Palmer, VP of fleet services at Estes Express Lines, the best way to assured success is through continuous improvement.
“In maintenance operations, you have to consistently move the needle,” Palmer told Fleet Maintenance, which is FleetOwner's sister publication.
How to move that needle, though? With fuel and payroll taking up larger shares than in the past, only so much is left for maintenance. Palmer advises fleets to use something they already have—measurable data—and to leverage their reporting capabilities, with an emphasis on key performance indicators (KPIs), the metrics that tell a business whether goals are being accomplished.
“With metrics, you can tell which way the wind is blowing, and then you can use KPIs to see where processes may be breaking down and need adjustment,” Palmer explained.
For Estes, the nation’s fifth largest LTL carrier, the stakes can be high. The company operates more than 9,000 tractors and 36,000 trailers. The fleet, which operates from over 270 locations in the U.S. and Canada, is serviced at 82 shops by nearly 800 technicians. Estes Express ranks No. 14 in the FleetOwner 500: Top For-Hire Fleets of 2022.
This means that small changes in operations can have big effects on all aspects of the business. In terms of maintenance KPIs, not realizing a change is beneficial or detrimental could impact uptime, which would reverberate across the fleet. That’s why, in this modern age where measuring data is so vital to the health of a truck, fleets must also remember data has always been important to the health of the overall organization.
Meaningful metrics
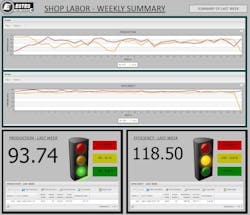
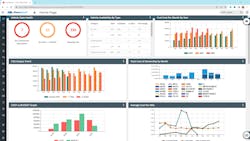
To track KPIs, you need to first capture data. Using Trimble’s TMT Fleet Maintenance software, Estes measures a wide range of key performance indicators in a series of dashboards, tracking metrics that indicate efficiency and proficiency. One of the key metrics it monitors is the number of vehicles that are down for service at each shop.
See also: Four ways a fleet’s C-suite can improve diagnostics efficiency
With that out-of-service data, Estes calculates how many hours are needed to complete service, as well as if an outside vendor is needed to help with the backlog. The data can also address issues where vehicles are waiting for parts. “Even if a shop can buy a part locally for a higher price, the value of uptime may exceed the added expense,” Palmer said.
“KPIs also give us visibility into labor,” Palmer continued. “We use SRTs (standard repair times) and metrics on hours worked, and direct versus indirect labor, to measure technician efficiency and productivity. That information also lets us establish a ratio of trucks per technician so we can adjust staffing levels as needed.”
Other KPIs measured at Estes focus on outside repair costs, road calls, parts, repeat repairs, overdue PMs, campaigns, and the number of rentals—which are an indicator of productivity. “All of those are used to more effectively plan shop workflow,” Palmer said. “In the end, it’s all about uptime.”
City of Yonkers, New York, Mayor Mike Spano’s Department of Public Works provided a list of the top metrics that are followed and described their value in more effectively maintaining the fleet of over 1,000 vehicles and pieces of equipment:
- Asset downtime metrics ensure that PM schedules are followed and determine what additional repairs are needed either in-house or with outside vendors.
- Technician proficiency metrics effectively assign repair work, determine where changes can be instituted, and eliminate downtime waiting for parts and locating vehicles.
- Inspection and PM program accuracy metrics indicate technician training needs, especially as newer vehicles are added to the fleet, to keep the comeback rate low.
Metrics make the data
Data overload is one issue maintenance providers encounter and must learn to keep in check. Choosing the right metrics will help do just that.
“We have increasing amounts of data available to us, so the question about KPIs becomes what can we do to make them relevant,” said Pete Russo, SVP of product management and solutions at Decisiv. “Raw data is useless unless you can reach a level where it’s intelligent and can directly affect decisions on what needs to be managed.”
And it can take a deeper dive to make that judgement. For example, Russo pointed out that measuring PM currency can tell you how often maintenance is completed but not how many PMs were done late. Likewise, repair time metrics can point to shop and technician proficiency, but if the estimated time to complete repairs is missed, the real cost is to the fleet in lost revenue.
See also: The data integration dilemma in trucking
Real-time data is essential for developing valuable KPIs, Russo noted. “Looking at fault code patterns leads to a better understanding about which alerts indicate critical repair needs, and trends in those metrics get you closer to predictability about failures,” he said. “Analyzing data that way puts you ahead of the curve rather than being reactive.”
On an industry level, Decisiv is utilizing its vast repository of actionable data derived from nearly four million annual repair events in partnership with TMC to elevate the ability to analyze maintenance and repair activity. In their quarterly North American Service Event Benchmark Report, the organizations track KPIs that highlight maintenance labor and parts costs by nine VMRS (vehicle maintenance reporting standards) System level codes.
What can be valuable for fleets as well, Russo added, is the ability to automate VMRS encoding. The capability that Decisiv offers analyzes individual service operations using Machine Learning (ML) and Artificial Intelligence (AI) to interpret information captured during the creation of a repair order and assigns VMRS codes to completed operations.
Another source of industry-level metrics is the TMC/FleetNet Vertical Benchmarking Program. Through the program’s quarterly Truckload Vertical Benchmark Study, which tracks mileage and uptime between unscheduled road repairs, fleets can access an analytic tool that allows them to drill into their data, comparing it to the industry average.
Leveraging the data
Management information technology is central to the development of metrics and the effective use of KPIs. Shaun Rowley, global head of product at Chevin Fleet Solutions, was quick to relate that vehicle downtime is a top metric to track.
“Looking at historical data, you can identify what faults have occurred on the same vehicle types,” he said. “That helps make sure the right parts are in place. It’s also about keeping technicians fully utilized and having the data to understand the size and complexity of repairs, which ensures that skill sets fit the job.”
Using data to focus on what to outsource is essential as well, Rowley noted. For example, say the standard time for rebuilding a gearbox is 10 hours, but because your technicians are not doing that work regularly, it takes them three times as long. Knowing that reveals that your technicians are only 30% productive for that job. The data can help you decide when it is more cost effective to do a job in house or if you are better off outsourcing.
“You can use historical data from your fleet management system to understand when and why vehicles typically break down to create an inspection program that is more effective or to know when maintenance is likely to be needed,” Rowley continued. “It can be as simple as creating clear rules.”
Management systems can generate information and reports to help support and measure actual performance, related Ben Johnson, director, product management at Mitchell 1. “If a fleet measures shop performance against established KPIs, that information can be used to identify performance gaps and close them,” he said.
One of the challenges today is in the collection and appropriate use of data that is available on most vehicles, Johnson noted. “That information is generally in silos which doesn’t expose it to the tools we have to create KPIs and deliver insights that are possible for predictive analytics,” he stated.
One example that Johnson mentioned was tying real-time vehicle mileage to maintenance records to help predict the next logical timeframes for service. That way the required maintenance can be performed during scheduled intervals instead of having a failure that can jeopardize goals.
“As a vehicle service history is built into an intelligent data pool, AI can be applied to those records and, based on usage models, a fleet could ascertain which vehicles, makes, models, powertrain configurations, etc. offer the lowest overall life of ownership cost,” Johnson said. “That KPI would advise a fleet when a vehicle has reached the end of its useful life without requiring a major investment to maintain its ability to meet operational needs. Then the fleet can make more informed decisions on which vehicles to replace to optimize that fleet’s lifecycles.”
Cory Anderson, FleetPride’s general manager and VP of service, pointed out that KPIs are important because shop throughput and asset downtime are affected by every aspect of the repair process.
“It begins with the manner in which maintenance or repair needs are communicated to the repair facility,” Anderson said. “Proactive fleet management begins with the process of alerting a repair facility to the vehicle’s needs, allowing them to prepare with parts and technician time, and that improves asset downtime.
“Technician proficiency is a critical measure, especially with the cost of labor continuing to rise,” Anderson continued. “That is also an important KPI for ensuring the quality of the repair and customer satisfaction.”
Establish targeted KPIs
For the ultimate success with metrics and KPIs, don’t let the data mislead you. In any analysis of commercial vehicle service activity, it’s important to understand the metrics and KPIs, noted Joel Levitt, president of Springfield Resources (and regular Fleet Maintenance columnist).
“Metrics are the data you watch and KPIs are the actual measures of success. In effect, metrics tell you what happened while KPIs give you an opening for action.
“For example, PM compliance is a metric while uptime is the KPI goal,” Levitt explained further. “Similarly, adherence to SRTs can tell you how productively technicians are performing while knowing actual labor times lets you find the cause of inefficiency, such as high rates of indirect labor.”
See also: During these disruptive times, technology can keep fleets prepared
With tight algorithms, it’s less likely you’ll be overwhelmed by data because you can rule out what’s not an issue and focus on what’s important. “Increasingly sophisticated technologies like AI can replace what was done statistically up until just a few years ago,” Levitt said. “Let’s say that in the past you knew that a component would average a certain number of miles before failure. Today, you can use sensors to see an impending failure and then establish a plan for replacement.
“That helps achieve the ultimate goal of truly predictive maintenance and the ability to use components for as long as possible and replace them for as little cost as possible,” Levitt added. “It’s why you should figure out the metrics or indicators to track and decide which KPIs work best for your operation, including those that may not always be obvious.”
This article originally appeared on Fleet Maintenance.
About the Author

Seth Skydel
Seth Skydel, a veteran industry editor, has more than four decades of experience in fleet management, trucking, and transportation and logistics publications. Today, in editorial and marketing roles, he writes about fleet, service, and transportation management, vehicle and information technology, and industry trends and issues.


