Image

Infographic: Safety Enforcement

Aug. 1, 2013
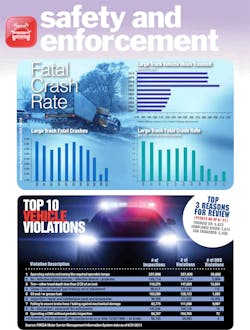
With the general trend showing truck mileage growing and crash rates dropping, CSA data shines a light on specific vehicle violations turned up by safety inspections. Share this graphic: Bit.ly link. 

With the general trend showing truck mileage growing and crash rates dropping, CSA data shines a light on specific vehicle violations turned up by safety inspections.  

Share this graphic: http://bit.ly/16v4xvY

Click on the image to see a larger version.

Voice your opinion!

To join the conversation, and become an exclusive member of FleetOwner, create an account today!

Sponsored Recommendations

Mitigate Risk with Data from Route Scores

Route Scores help fleets navigate the risk factors they encounter in the lanes they travel, helping to keep costs down.

Uniting for Bold Solutions to Tackle Transportation’s Biggest Challenges

Over 300 leaders in transportation, logistics, and distribution gathered at Ignite 2024. From new products to innovative solutions, Ignite highlighted the importance of strong...

Seasonal Strategies for Maintaining a Safe & Efficient Fleet Year-Round

Prepare your fleet for every season! From winterizing vehicles to summer heat safety, our eBook covers essential strategies for year-round fleet safety. Download now to reduce...

Streamline Compliance, Ensure Safety and Maximize Driver's Time

Truck weight isn’t the first thing that comes to mind when considering operational efficiency, hours-of-service regulations, and safety ratings, but it can affect all three.