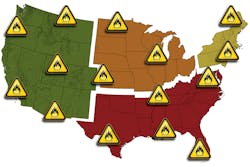
A new report compiled by software engineering and data mining firm Vigillo determined that there is an ongoing “enforcement disparity” by county and state when it comes to Compliance, Safety Accountability (CSA) inspections.
Titled “Comprehensive State Enforcement Statistics,” Vigillo CEO Steven Bryan noted that the report is a comparative analysis of inspections, violations and crashes for the 48 contiguous U.S. states, drilled down to the county level and normalized by the number of commercial vehicle miles traveled.
“We’d been hearing from many of our customers that they’d experienced an ‘inconsistent’ level of enforcement across the states they operate in,” Bryan told Fleet Owner. “It’s been an issue with CSA for a while, but it really began heating up this summer in our conversations with customers. We decided to really dig into the inspection data to see what was going on.”
In peeling back CSA inspection data down to the county level, Vigillo’s engineers discovered what Bryan called interesting trends. “For example, we found that state-level data indicated Arizona wrote up the most violations for ‘non-English speaking’ drivers,” he said. “But in drilling down into the data, we found 99% of those violation write-ups occurred in just Pima County, which sits right on the border with Mexico.”
With this knowledge, Bryan noted, carriers could eliminate a possible violation by ensuring that any drivers they send into or around Pima County speak English well.
Vigillo’s data analysis also determined that Cecil County, MD, showed what Bryan called “lopsided enforcement” of tire tread violations compared to the rest of Maryland—another data point carriers operating in that area should share with their personnel.
Research conducted last year by Jack Lesshafft, a senior safety representative for Great West Casualty Co., also highlighted the inconsistent CSA enforcement trend. He said such inconsistent data continues to dog the now three-year-old safety program.
During a presentation at the National Tank Truck Carriers Tank Truck Safety & Security Council Seminar in New Orleans last year, Lesshafft noted that part of the problem with CSA is that “48 different jurisdictions” interpret these regulations. While the U.S. average for out-of-service (OOS) violations hit 2.6 per one million miles last year, he explained, Arizona recorded an OOS rate of 11.6, followed by 7.6 for Minnesota and 6.4 for Maryland. On the other hand, neither Colorado nor Nebraska had any OOS violations.
Here’s another interesting fact uncovered by Lesshafft regarding hours-of-service (HOS) violations: Though the U.S. posted a low average overall (0.8 per million miles), several states had far larger numbers, such as Mississippi (2.9), Maryland (2.7), California (2.6), Iowa (2.4), New Jersey (2.2), Missouri (1.8), and Kentucky (1.4).
“Not everyone is enforcing this equally,” he stressed. “With numbers that high and the U.S. average so low, you can imagine there are a bunch of states that don’t have any violations.”
Vigillo’s Bryan, however, stressed that he doesn’t believe such CSA enforcement disparities are deliberate in any way. “In our research, this is simply reporting inspection data tied by GPS data to specific locations, which can even be drilled down to specific officer badge number,” he cautioned.
About the Author
Sean Kilcarr
Editor in Chief
Sean Kilcarr is a former longtime FleetOwner senior editor who wrote for the publication from 2000 to 2018. He served as editor-in-chief from 2017 to 2018.
