So, do you want to know where the “best drivers” live in the U.S.? The ones with the lowest crash risk in the country? Then you’d best head up to Sioux Falls, SD (and do it QUCK because winter is on its way and it gets DANG cold up thar) because that’s where they reside and drive – at least according to the claims data analyzed by Allstate Insurance Co.
The insurance giant annually produces an America's Best Drivers Report that – based upon Allstate claims data – ranks America's 200 largest cities in terms of car collision frequency, helping identify which cities have the safest drivers based on their crash risk.
For 2012 – for the fifth time in the eight years Allstate’s conducted this study – Sioux Falls takes the top spot, with the average driver in that fair city only experiencing an auto collision every 13.8 years, which is 27.6% better than the national average of 10 years.
[Here’s a video synopsis detailing more findings from Allstate’s annual “best drivers” report.]
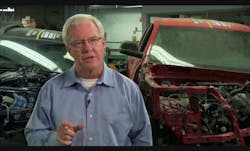
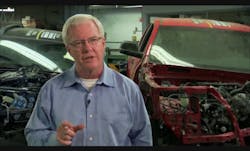
“We created this report to boost the country's discussion on safe driving, and each year we hope it will increase awareness about the importance of being tolerant and attentive behind the wheel," noted Mike Roche, senior VP for claims at Allstate.
He added that while car crash fatalities are at the lowest level they've ever been since 1949, deaths from vehicle accidents still claim an average more than 32,000 lives every year, according to data tracked by the National Highway Traffic Safety Administration (NHTSA)."That’s why it is vital for us to educate American drivers about safe driving behaviors they can demonstrate on the road that will help make our roadways safer," stressed Roche (at right). "Minimizing distractions, obeying traffic laws, and using your car's safety features like turn signals and headlights, are all ways to be safer, no matter where you drive."
So, how does Allstate come up with these rankings, anyhow?
For starters, the company noted that its actuaries conduct an in-depth analysis of internal property damage reported over a two-year period – from January 2009 to December 2010 – to ensure the findings would not be impacted by external influences such as weather or road construction. A weighted average of the two-year numbers then determines the annual percentages, the insurer pointed out.
Allstate added that its automotive insurance policies represent about 10% of all U.S. auto policies, making this report a realistic snapshot of what's happening on America's roadways.
Here’s some more data from Allstate’s report to chew on. First, the top ten cities with the safest drivers are:
|
City & Overall Ranking |
Collision Likelihood Compared to National Average |
Average Years Between Collisions |
|
1. Sioux Falls, S.D. |
27.6% less likely |
13.8 |
|
2. Boise, Idaho |
27.3% less likely |
13.8 |
|
3. Fort Collins, Colo. |
26.7% less likely |
13.6 |
|
4. Madison, Wisc. |
23.0% less likely |
13.0 |
|
5. Lincoln, Neb. |
19.3% less likely |
12.4 |
|
6. Huntsville, Ala. |
19.1% less likely |
12.4 |
|
7. Chandler, Ariz. |
18.9% less likely |
12.3 |
|
8. Reno, Nev. |
18.4% less likely |
12.3 |
|
9. Knoxville, Tenn. |
18.1% less likely |
12.2 |
|
10. Springfield, Mo. |
17.4% less likely |
12.1 |
For the eighth year in a row, motorists in Phoenix topped the list among commuters in American cities with more than one million people. Rankings among these cities:
|
City & Overall Ranking |
Collision Likelihood Compared to National Average |
Average Years Between Collisions |
|
53. Phoenix, Ariz. |
1.6% less likely |
10.2 |
|
124. San Diego, Calif. |
14.0% more likely |
8.8 |
|
141 San Antonio, Texas |
20.4% more likely |
8.3 |
|
152. Chicago, Ill. |
25.9% more likely |
7.9 |
|
153. Houston, Texas |
25.9% more likely |
7.9 |
|
167. Dallas, Texas |
32.8% more likely |
7.5 |
|
176. New York, N.Y. |
41.1% more likely |
7.1 |
|
182. Los Angeles, Calif. |
48.5% more likely |
6.7 |
|
190. Philadelphia, Pa. |
64.1% more likely |
6.1 |
And here are cities holding the top spot for their respective city size:
|
City Population |
City & Overall Ranking |
Collision Likelihood Compared to National Average |
Average Years Between Collisions |
|
750,000 - 1 million |
60. Indianapolis, Ind. |
0.6% less likely |
10.1 |
|
500,000 - 749,999 |
13. Tucson, Ariz. |
16.4% less likely |
12.0 |
|
250,000 - 499,999 |
5. Lincoln, Neb. |
19.3% less likely |
12.4 |
Allstate’s Roche also offers some driving advice gleaned from the company’s research – advice tailored to the specific types of areas motorists operate within.
For example, take big-city versus small-city driving, he said: Different levels and types of traffic, noise and activity, as well as varying road conditions and rules, can make big city driving different than driving in smaller cities or more suburban areas.
So here are some tips for driving in “big” cities:
- Allow plenty of time to reach your destination. Stop-and-go traffic, gridlock, traffic signal stops, pedestrian walkways and events that create traffic detours can add time to your travel.
- Know what's happening in the city during the time you're driving. Find out if there are events that may impact traffic, and listen to traffic reports on your car radio. Avoid traffic jams or explore alternative routes, if possible.
- Stay alert. Be prepared to frequently stop or slow down for pedestrians, emergency vehicles, delivery trucks, parking cars, taxi cabs, and public transportation vehicles such as city buses.
- Get directions to where you're going. Review directions carefully in advance. If you get lost mid-trip, safely pull over and wait until you feel calm enough to get back on the road, using that time to get directions, check traffic or call for help.
Now, here’s some advice for driving in smaller cities and suburban areas – advice that thankfully includes insight concerning the needs of big rigs:
- Watch the speed limit. Speed limits may be greater than in city traffic, which can lead some drivers to speed up and make roads dangerous.
- Look out for pedestrians, especially children. While there are typically fewer pedestrians or obstacles than in large metropolitan areas, there are also typically fewer crosswalks, so pedestrians may be less aware of traffic rules such as where and when to cross the street.
- Know the rules of the road. Suburban streets typically have fewer streetlights and signs, or greater distance between lights and signs. This means darker conditions when driving at night and less opportunity to be reminded of speed limits and other road rules throughout the day.
- Keep a safe distance, especially around large vehicles. Large vehicles like semi-trucks are more likely found on suburban roads than in large metro areas. Keep a safe distance between your vehicle and others, and know that truck drivers might have limited visibility. If you attempt to pass a truck, make sure you have plenty of time and space to maneuver safely.
Good advice there – advice that hopefully more drivers will follow. Who knows? Maybe good old Springfield, VA, might make the “top ten” list one day. Well, best not to get my hopes up.

