Market truckload rates steady; fuel price drops
The total number of van, refrigerated, and flatbed loads posted on DAT load boards edged down 1.5% while available capacity was up 1.9% during the week ending September 27, according to DAT Solutions, which operates the DAT network of load boards.
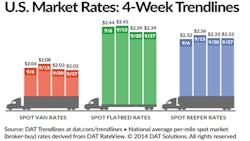
Nationally, average spot truckload rates were stable for all three major equipment types compared with the previous week.
The national average van rate lost a penny to $2.02 per mile, but remained above $2.00 per mile throughout September. Looking at market demand, van freight availability was generally level (down 0.6%) and truckload capacity increased 3.2%. The resulting load-to-truck ratio was 3.0 as a national average, meaning there were 3.0 van loads posted for every van available on DAT load boards, a 3.6% decline versus the previous week.
For refrigerated freight, the national average spot rate was unchanged at $2.33 per mile. Rates declined in central California and across the Midwest but gained strength elsewhere due to late-season produce harvests. Reefer freight availability slipped another 1.3% compared with the previous week and capacity added 1.2%, producing a reefer load-to-truck ratio of 8.8.
Also unchanged was the national average flatbed rate at $2.39 per mile. Load availability lost 2.2% and capacity remained stable (down 0.2%), resulting in a 2.4% decline in the load-to-truck ratio. That key indicator is now at 29.3 loads per truck, which is still strong for the season.
The national average fuel price fell two cents to $3.76. Declining fuel prices tend to have a dampening effect on market rates, and diesel fuel is now 17.2 cents less than one year ago. One-time rate agreements typically are quoted as “all-in” so the fuel surcharge is not broken out. When fuel prices slip, the surcharge drops and the total rate may decline accordingly.
Load-to-truck ratios represent the number of loads posted for every truck available on DAT load boards. The load-to-truck ratio is a sensitive, real-time indicator of the balance between spot market demand and capacity. Changes in the ratio often signal impending changes in rates.
Rates are derived from DAT RateView, which provides real-time reports on prevailing spot market and contract rates, as well as historical rate and capacity trends. RateView’s database is comprised of more than $24 billion in freight bills in more than 65,000 lanes.
For complete national and regional reports on spot rates and demand, go to www.dat.com/Trendlines.

