Spot market rates, activity decline; capacity unchanged
The number of van, refrigerated, and flatbed freight postings on DAT load boards slipped 3.5% while available capacity was unchanged during the week ending September 20, according to DAT Solutions, which operates the DAT network of load boards.
Load-to-truck ratios and rates slipped across all three equipment types compared with the previous week. The declines are consistent with seasonal trends but still but reflect robust activity.
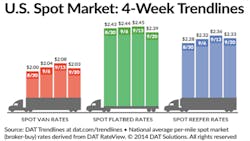
The national average van rate fell 5 cents (2.4%) to $2.03 per mile. Rates picked up across the West, however, including an 8-cent gain out of Denver CO to $1.44 per mile. Van freight availability dipped 2.1% while capacity remained stable, producing a load-to-truck ratio of 3.1 as a national average, a 1.9% decline versus the previous week. A load-to-truck ratio of 3.1 means there were 3.1 van loads posted for every van available on DAT load boards.
For refrigerated freight, the national average spot rate was down 3 cents (1.3%) to $2.33 per mile. Rates gained strength outbound from Elizabeth NJ and Ontario CA, home to several key distribution centers and an origin point for shipments of seasonal groceries and Halloween candy. Reefer freight availability slipped 3.2% the week ending September 20 and capacity was stable, producing an 8.8 load-to-truck ratio, a 3.1% decline.
At $2.39 per mile, the national average flatbed rate dropped 6 cents (2.4%) despite strong demand for flatbeds and constrained capacity. The number of available flatbed loads fell 4.0% and capacity rose 1.7%, resulting in a 5.6% decline in the load-to-truck ratio, to 30.1 loads per truck.
Load-to-truck ratios represent the number of loads posted for every truck posted on DAT load boards. The load-to-truck ratio is a sensitive, real-time indicator of the balance between spot market demand and capacity. Changes in the ratio often signal impending changes in rates.
Rates are derived from DAT RateView, which provides real-time reports on prevailing spot market and contract rates, as well as historical rate and capacity trends. RateView’s database is comprised of more than $24 billion in freight bills in more than 65,000 lanes.
For complete national and regional reports on spot rates and demand, access www.dat.com/Trendlines.