Spot rates continue strong as activity accelerates
Activity on the DAT network of load boards picked up after Thanksgiving, according to DAT Solutions, as available capacity jumped 11% and the number of posted loads increased 20% during the week ending December 6, 2014. The gains are typical of the first full week after a holiday.
The bigger storyline is the continued general strength of spot market rates.
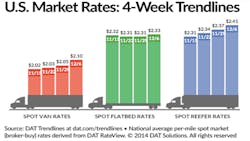
Compared with the previous week, the national average van rate gained 5 cents to $2.10 per mile despite a 1-cent decline in the fuel surcharge. The average rate for flatbed loads increased 2 cents to $2.33 per mile while the refrigerated rate advanced 4 cents to $2.41.
Regionally, the average van rate from Los Angeles CA fell 12 cents to $2.46 per mile. The highest-paying van lane in the West was Los Angeles to Denver CO at $3.37 per mile, up 22 cents versus the previous week. Other high-paying markets by region:
•Buffalo NY, $2.16 per mile (down 16 cents)
•Memphis TN, $2.39 per mile (down 5 cents)
•Dallas TX, $1.81 per mile (down 6 cents)
•Chicago IL, $2.32 per mile (down 12 cents)
Van freight availability was up 9.6% for the week while available van capacity increased 7.6%. The national average load-to-truck ratio for vans rose 1.8%, from 4.4 to 4.5 loads per truck. That means there were 4.5 van loads posted for every van on DAT load boards the week ending December 6.
A 17% gain in demand for reefer capacity on the spot market, coupled with a 7.7% capacity increase, moved the refrigerated load-to-truck ratio up 8.9% from 11.6 to 12.6 loads per truck.
The average reefer rate from McAllen TX climbed 6 cents to $1.92 per mile. Other key regional markets reflected a downward rate trend, including Chicago (down 15 cents to an average of $3.21 per mile), Philadelphia PA (off 5 cents to $2.76 per mile), and Los Angeles (20 cents lower to $2.90 per mile).
Flatbed load availability surged 40% after a 28% decline during the Thanksgiving week. The number of available trucks increased 28%, which pushed the load-to-truck ratio up 8.9% to 18.2 loads per truck as a national average.
Load-to-truck ratios represent the number of loads posted for every truck available on DAT load boards. The load-to-truck ratio is a sensitive, real-time indicator of the balance between spot market demand and capacity. Changes in the ratio often signal impending changes in rates.
The national average fuel price dropped 6 cents to $3.54 per gallon. Declining fuel prices tend to have a dampening effect on market rates. When fuel prices slip, the surcharge drops and the total rate may fall accordingly.
Rates are derived from DAT RateView, which provides real-time reports on prevailing spot market and contract rates, as well as historical rate and capacity trends. RateView’s database consists of more than $24 billion in freight bills in more than 65,000 lanes.
For complete national and regional reports on spot rates and demand, access www.dat.com/Trendlines.

