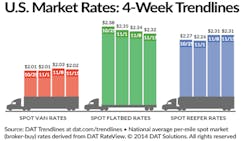
Spot market van rates dip but remain higher than $2
Available loads and capacity were both up during the week ending November 15, 2014, according to DAT Solutions. The number of spot market loads posted on the DAT network of load boards increased 2.7% compared with the previous week while the number of van, refrigerated, and flatbed trucks rose 4.5%.
The national average van rate lost a penny to $2.02 per mile but remained above $2 for another week, as it has for most of 2014. The average rate for refrigerated loads was unchanged at $2.31 per mile while the flatbed rate ($2.32 per mile, down 2 cents) slowed in a seasonal trend.
Regionally, Los Angeles CA-outbound lanes stayed hot due to port congestion and difficulty accessing rail services. For van freight, the high lane in the region was Los Angeles to Phoenix AZ at $3.11 per mile, down 3 cents from the previous week. Other high-paying van lanes by region:
•Columbus OH to Buffalo NY, $3.64 per mile (up 40 cents)
•Atlanta GA to Orlando FL, $2.74 per mile (down 8 cents)
•Philadelphia PA to Boston MA, $3.68 per mile (up 6 cents)
•Dallas TX to Houston TX, $2.54 per mile (up 3 cents)
Nationally, the number of available van loads was up 5.1% the week ending November 15 while capacity added 4.5%. The load-to-truck ratio held firm at 3.0, meaning there were 3.0 van loads posted for every van available on DAT load boards that week.
Reefer freight availability increased 12% while capacity gained 4.5%. The resulting load-to-truck ratio was 9.8. The average rate from Sacramento CA jumped 13 cents to $2.73 per mile on late-season volumes. Outbound reefer rates from McAllen TX climbed 3 cents to $1.83 per mile.
The number of available flatbed loads fell 5.8% against a 4.7% increase in available capacity. The national average flatbed load-to-truck ration dropped 10% to 16.8 loads per truck.
Load-to-truck ratios represent the number of loads posted for every truck available on DAT load boards. The load-to-truck ratio is a sensitive, real-time indicator of the balance between spot market demand and capacity. Changes in the ratio often signal impending changes in rates.
The national average fuel price dipped 2 cents to $3.66 per gallon. Declining fuel prices tend to have a dampening effect on market rates. When fuel prices slip, the surcharge drops and the total rate may decline accordingly.
Rates are derived from DAT RateView, which provides real-time reports on prevailing spot market and contract rates, as well as historical rate and capacity trends. RateView’s database is comprised of more than $24 billion in freight bills in more than 65,000 lanes.
Access www.dat.com for more information.

