Spot truckload market freight availability rebounds
Freight availability on the spot truckload market rebounded 14% and capacity dipped 0.8% during the week ending February 28, 2015, according to DAT Solutions, which operates the DAT network of load boards.
Average rates responded with a 1-cent increase across all three equipment categories compared with the previous week.Rates improve
Average outbound spot rates gained on the strength of rising fuel surcharges.
The national average van rate picked up 1 cent to $1.88 per mile on the strength of several key van markets. Memphis TN increased 12 cents to $2.30 per mile; Columbus OH jumped 3 cents to $2.15 per mile; Dallas TX was up 6 cents to $1.76 per mile; and Buffalo NY rose 4 cents to $2.22 per mile. Outbound van rates from Los Angeles CA rose 4 cents per mile to $1.92 as the dockworkers and West Coast port operators reached a tentative labor agreement.
The national average flatbed and reefer rates each rose a penny to $2.13 and $2.11 per mile, respectively.Capacity gains
Van freight availability on DAT load boards rose another 19% the week ending February 28 while capacity remained stable (down only 0.8%) versus the previous week. That pushed the load-to-truck ratio up 19.5% from 2.7 loads per truck to 3.2, meaning there were 3.2 van loads posted for every available van trailer on DAT load boards the week ending February 28.
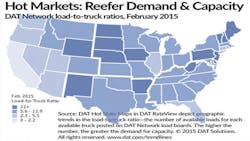
Reefer freight availability rose 18% the week ending February 28 and capacity declined 2.9%, which boosted the reefer load-to-truck ratio by 21% from 7.9 to 9.5. Flatbed load availability increased 10% while capacity added 1%; the flatbed load-to-truck ratio recovered 9.0% from 11.4 to 12.4.
Load-to-truck ratios represent the number of loads posted for every truck available on DAT load boards. The load-to-truck ratio is a sensitive, real-time indicator of the balance between spot market demand and capacity. Changes in the ratio often signal impending changes in rates.
Rates are derived from DAT RateView, which provides real-time reports on prevailing spot market and contract rates, as well as historical rate and capacity trends. For complete national and regional reports on spot rates and demand, access www.dat.com/Trendlines.

