Spot market volume drops 19%; truckload rates decline
Spot market volume slipped and average truckload rates edged downward during the week ending January 24, 2015, reported DAT Solutions, which operates the DAT network of load boards.
The number of loads posted on DAT boards fell 19% against a 15% increase in the number of trucks posted compared with the previous week. This slowdown in freight and rate growth follows typical seasonal patterns.
Some key metrics from DAT Trendlines for the week:
•Load-to-truck ratios drop—The number of available vans increased 16% for the week. This pushed the van load-to-truck ratio from 3.1 to 2.2, meaning there were 2.2 van loads posted for every available van on DAT load boards the week ending January 24, the lowest mark since November 2013. Flatbed capacity rose 14% as the flatbed load-to-truck ratio dropped from 13.7 down to 10.0 loads per truck. The reefer load-to-truck ratio declined from 10.1 to 6.9 reefer loads per truck.
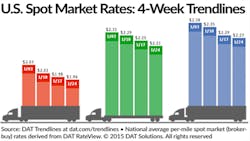
•Spot rates slide—With more capacity on the market, the national average van rate fell 2 cents to $1.96 per mile (the line-haul portion of the rate slipped 1 cent and the average fuel surcharge lost 1 cent). Despite the average van rate from Los Angeles CA falling 9 cents to $2.00 a mile on congested port traffic, the West was the only region to see average rates rise, including a 4-cent increase out of Denver CO ($1.38 per mile).
The national average flatbed rate was $2.21 per mile, off 4 cents, and the rate for refrigerated freight dipped 2 cents to $2.27.
•Fuel tumbles—The national average fuel price ended the week down 6 cents at $2.87 per gallon. Declining fuel prices tend to have a dampening effect on spot market rates. When fuel prices fall, the surcharge drops and the total rate may decrease accordingly.
Load-to-truck ratios represent the number of loads posted for every truck available on DAT load boards. The load-to-truck ratio is a sensitive, real-time indicator of the balance between spot market demand and capacity. Changes in the ratio often signal impending changes in rates.
Rates are derived from DAT RateView, which provides real-time reports on prevailing spot market and contract rates, as well as historical rate and capacity trends. RateView’s database is comprised of more than $24 billion in freight bills in more than 65,000 lanes.
For complete national and regional reports on spot rates and demand, go to www.dat.com/Trendlines.

