Refrigeratedtransporter 1601 Spot Mkt Chart Nov 14

Spot market capacity gain, load loss help lower rates

Nov. 25, 2015
The number of available trucks on the spot truckload market jumped 4.2% and the number of posted loads tumbled 4.1% during the week ending November 14, 2015, according to DAT Solutions, which operates the DAT network of load boards.

The number of available trucks on the spot truckload market jumped 4.2% and the number of posted loads tumbled 4.1% during the week ending November 14, 2015, according to DAT Solutions, which operates the DAT network of load boards.

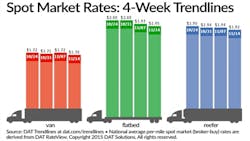
Offsetting capacity gain and decline in available loads helped push national average spot market rates down 2 cents for van, refrigerated, and flatbed freight. This comes at a time when shippers typically have holiday goods to move.

The national average truckload van spot market rate fell to $1.70 per mile and slipped in key markets including Los Angeles CA (down 2 cents to $1.99 per mile) and Memphis TN (down 6 cents to $1.97) despite higher volumes. Van load availability held steady (up 0.5%) and capacity increased 3.7%. The van load-to-truck ratio was unchanged from the previous week at 1.6 loads per truck, meaning there were 1.6 available van loads for every truck posted on the DAT network.

For refrigerated freight, the national average spot rate dropped to $1.92 per mile, although outbound rates rose in major markets including Elizabeth NJ (up 10 cents to $1.76) and McAllen TX (up 2 cents to $1.68). The number of available reefer loads climbed 6.4% while truck capacity was up just 1.9%, which sent the load-to-truck ratio up 4.4% to 4.1 loads per truck.

Flatbed load availability sunk 16.7% against a gain of 8.9% in truck posts. The national flatbed load-to-truck ratio gave up 23.5% to 6.2 loads per truck and the national average flatbed rate dropped to $1.95 per mile.

The national average price of diesel fell 2 cents to $2.48 per gallon the week ending November 14. All reported rates include fuel surcharges.

Rates are derived from DAT RateView, which provides real-time reports on prevailing spot market and contract rates, as well as historical rate and capacity trends. Load-to-truck ratios represent the number of loads posted for every truck available on DAT load boards. The load-to-truck ratio is a sensitive, real-time indicator of the balance between spot market demand and capacity. Changes in the ratio often signal impending changes in rates.

For complete national and regional reports on spot rates and demand, see www.dat.com/Trendlines.
Sponsored Recommendations

Heavy-Duty Maintenance Checklist

A maintenance checklist can help ensure you hit everything necessary during an inspection. Check out our free downloadable checklist to help streamline your repairs.

Five Ways a Little Data Can Save Your Company Millions

While most trucking and logistics companies rely on cellular to keep their work fleet connected, satellite has the ability to connect anywhere and through small data transmission...

Fleet Case Study: 15% YOY Growth for ITDS

Learn how this small trucking company scaled significantly and maintained outstanding customer service without adding additional people. Sylectus TMS can automate operations and...

Unlocking Fleet Safety & Efficiency: The Managed Service Advantage

Want to boost your fleet's safety and efficiency? Tune in now to discover the power of Managed Services in optimizing your safety program, streamlining operations, and making ...

Voice your opinion!

To join the conversation, and become an exclusive member of FleetOwner, create an account today!