Spot truckload volume surges 10% before holiday
The number of loads on the spot truckload market jumped 10% during the week ending July 2, 2016, as shippers rushed to move freight before the end of the quarter and the start of the July 4 weekend, reported DAT Solutions, which operates the DAT network of load boards.
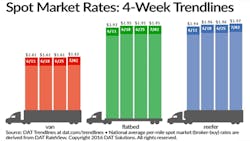
Nationally, the average van and reefer rate each gained 1 cent to $1.62/mile and $1.97/mile, respectively, while the average flatbed rate was $1.95/mile for the third consecutive week.
Vans—The van load-to-truck ratio ended the week up 9% to 3.4 loads per truck. As an average, the van ratio was higher in June than it was in June 2015, the first year-over-year increase in 2016.
•Southeast—Charlotte NC, $2.08/mile, unchanged
•West—Los Angeles CA, $2.13/mile, up 5 cents
•Midwest—Chicago IL, $1.92/mile, up 7 cents
•South Central—Houston TX, $1.60/mile, up 3 cents
•Northeast—Allentown PA, $2.02/mile, up 5 cents
Reefers—With an average load-to-truck ratio of 6.4 the week ending July 2, the national reefer rate rose again and finished June 8 cents higher than it was in May—the third straight month of national average reefer rate increases.
In the Northeast, New Jersey produce is moving, adding to freight volumes and boosting rates on key lanes out of Elizabeth NJ and Philadelphia PA:
•Elizabeth to Lakeland FL, rates rose 23 cents to $1.64/mile
•Philadelphia to Miami FL added 24 cents to $1.83/mile
California and the Southeast are the hottest areas for reefer loads, and rates rose in both regions the week ending July 2.
Flatbeds—The number of flatbed load posts dipped another 7% and capacity rose 5% the week ending July 2. The flatbed load-to-truck ratio fell 11% to 15.7 loads per truck, and rates are trending down in Northeastern markets, including an average drop of 5 cents on major outbound lanes originating in Baltimore MD. Flatbeds also lost traction in smaller regional freight markets such as Pittsburgh PA and Harrisburg PA.
Rates are derived from DAT RateView, which provides real-time reports on prevailing spot market and contract rates, as well as historical rate and capacity trends. All reported rates include fuel surcharges.
Get the latest rate trends at www.DAT.com/Trendlines.