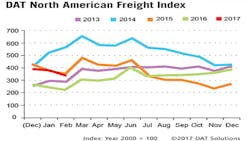
Spot truckload freight volume proves vigorous
Total freight volume was 48% higher in February 2017 than in the same month of 2016, although the DAT North American Freight Index fell 13% and spot truckload rates softened in February compared with January. An influx of capacity from contract carriers held down spot van and refrigerated freight rates.
“Volume on the spot market in February was robust for what is traditionally a slow month for freight,” said Don Thornton, senior vice-president, DAT Solutions, which operates an on-demand freight exchange for spot truckload freight. “The strong freight volumes attracted an unusual number of contract carriers, and the added capacity helped keep rates down on many high-traffic van and reefer lanes until late in February, when national average contract rates began to firm up.”
Compared with January, the national average spot van rate was $1.62 per mile including a fuel surcharge, down 5 cents, while the average reefer rate was $1.86 per mile, down 9 cents. However, by the last week of February, load-to-truck ratios were up sharply and spot rates had increased week over week.
Although month-over-month spot van and reefer load posts declined in February, demand for flatbed trucks rose 27%. The flatbed load-to-truck ratio was 26.6, meaning there were 26.6 available flatbed loads for each truck on the DAT network.
“Flatbed freight includes building materials and heavy machinery,” said Thornton. “High volume indicates activity in construction and energy sectors in particular, as drillers take advantage of crude prices that have been mostly over $50 a barrel since OPEC agreed to cut supplies in late November.”
The national average spot flatbed rate was $1.96 per mile, 4 cents higher than in January.
Established in 1978, DAT operates a network of load boards serving intermediaries and carriers across North America. For more than a decade it has published its Freight Index, which is representative of the dynamic spot market.
Reference rates are the averages, by equipment type, based on $33 billion of actual transactions between freight brokers and carriers, as recorded in DAT RateView. Rates are cited for linehaul only, except where noted. Beginning in January 2015, the DAT Freight Index was rebased so 100 on the index represents the average monthly volume in the year 2000.
Access www.DAT.com for further information.
