January’s spot truckload freight settles into post-holiday pattern
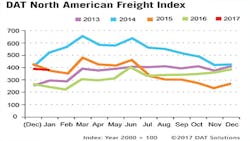
In January 2017, the DAT North American Freight Index slipped downward as spot truckload freight entered a typical post-holiday pattern, though at elevated levels compared with the same time in 2016.
The index dropped 2.5% in January compared with an extremely strong December and was 56% higher year over year, said DAT Solutions, which operates an on-demand freight exchange for spot freight.
Spot van, refrigerated, and flatbed rates in January were higher year over year, but an influx of capacity from contract carriers onto the spot market—particularly on high-traffic lanes—depressed rates versus December.
“Coming off a high in December, January was still very solid for spot freight,” said Don Thornton, senior vice-president at DAT. “As a result, we saw more contract carriers make their trucks available on load boards, and the added capacity contributed to lower rates on many high-traffic lanes.”
Compared with December, the volume of van freight on the spot market was down 9% in January but up 63% year over year. The national average rate for vans was $1.68 per mile including a fuel surcharge, off 5 cents versus December but 2 cents more year over year.
Refrigerated freight followed a similar trend. The number of available loads retreated 8% in January but was 57% higher year over year. Available capacity climbed 1%.
The national average spot rate for refrigerated freight was $1.96 per mile including a fuel surcharge, 3 cents lower than December but 6 cents higher compared with January 2016.
Demand for flatbed trucks advanced 18% over December and 64% year over year. Available capacity rose just 3%.
At $1.91 per mile, the national average flatbed rate was 5 cents lower than December but 3 cents higher year over year.
Established in 1978, DAT operates a network of load boards serving intermediaries and carriers across North America. For more than a decade DAT has published its Freight Index, which is representative of the dynamic spot market.
Reference rates are the averages, by equipment type, based on $33 billion of actual transactions between freight brokers and carriers, as benchmarked in DAT RateView. Rates are cited for linehaul only, except where noted.
See www.DAT.com for more information.
