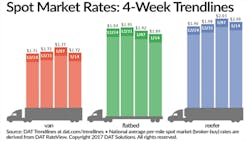
Spot truckload volumes, capacity surge; rates retreat
Spot truckload volumes increased 18% but a 34% jump in available capacity sent load-to-truck ratios lower during the week ending January 14, 2017, said DAT Solutions, which operates the DAT network of load boards.
With more trucks in the marketplace during the first full week of the year, rates fell for all three equipment types:
•Reefers—$2.00/mile, down 3 cents
•Vans—$1.72/mile, down 5 cents
•Flatbeds—$1.89/mile, down 3 cents
Those rates include a fuel surcharge. The average price of on-highway diesel slipped 1 cent to $2.59/gallon.
Reefer trends—Reefer load posts rose 8%, but the number of available reefers surged 27%. This helped push the reefer load-to-truck ratio down 15% to 9.1 reefer loads per truck.
While the national average reefer rate decreased 3 cents the week ending January 14, $2.00/mile is still a strong rate for mid-January. Prices were mixed on key produce lanes:
Rates were down in all major reefer markets in California the week ending January 14 as the state was hit by heavy rains in the lower elevations and heavy snow in the mountains. The average outbound rate from Los Angeles dropped 3 cents to $2.46/mile.
Imports are driving more activity at McAllen TX, where the average outbound rate was $2.05/mile, up 4 cents. McAllen-Dallas was up 24 cents to $2.58/mile.
Lakeland FL, with an average rate of $1.38/mile, dipped 2 cents. Several outbound lanes lost ground, too, notably Lakeland-Charlotte NC, down 38 cents the week ending January 14 to $1.21/mile.
Van trends–The number of available vans was up 36% compared with the previous week while van load posts rose more gradually at 14%.
The van load-to-truck ratio slipped from 4.7 to 3.9 loads per truck, which is still unseasonably high for vans.
Spot van rates declined in many van markets, including key regional hubs:
•Chicago, $2.10/mile, down 1 cent
•Dallas, $1.57/mile, down 1 cent
•Atlanta, $1.90/mile, down 6 cents
•Philadelphia, $1.75/mile, unchanged
•Los Angeles, $1.99/mile, down 6 cents
Flatbed trends—Flatbed demand bounced back with a 31% gain in available loads. Truck posts climbed 38% compared with the previous week, sending the load-to-truck ratio down slightly to 27.1 loads per truck.
Rates are derived from DAT RateView, which provides real-time reports on prevailing spot market and contract rates, as well as historical rate and capacity trends. All reported rates include fuel surcharges.
For the latest spot market load availability and rate information, see www.dat.com/trendlines.
