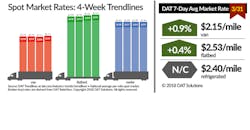
Spot truckload capacity tightens 3.1%; total of loads jumps 3.5%
The number of trucks on the spot truckload freight market did not keep pace with demand from shippers wanting to move goods before the end of Q1 and the start of the Easter holiday, sending rates and load-to-truck ratios higher.
Capacity on DAT load boards fell 3.1% while the number of loads jumped 3.5% during the week ending March 31, 2018, which included Good Friday, when freight traffic is typically low. Refrigerated and van load-to-truck ratios remained solid, and the flatbed segment hit another record high.
•Reefer ratio—10.4, virtually unchanged from 10.5
•Van ratio—7.2, up from 6.9
•Flatbed ratio—101.5 available loads per truck, up from 87.7 the previous week
National average rates held steady:
•Reefer rate—$2.40/mile, unchanged for the fifth straight week
•Van rate—$2.15/mile, up 2 cents
•Flatbed rate—$2.53/mile, up 1 cent
Heading into Easter weekend, the number of reefer load posts dipped 1.2% while truck posts dropped 2%. The national average rate was unchanged and rates were lower on 37 of the top 70 reefer lanes. Pricing from the Southeast and West show that shippers in the Southeast and West have produce to move, however:
—Miami-Baltimore, up 24 cents to $2.28/mile
—Los Angeles-Portland OR, up 21 cents to $2.96/mile
—McAllen TX-Elizabeth NJ, up 20 cents to $2.64/mile, back to where the rate was three weeks ago
—Imperial Valley (Ontario CA)-Chicago, up 29 cents to $2.14/mile
The number of available van loads increased 1% while truck posts declined 3%. Spot rates were higher on 65 of DAT’s Top 100 van lanes, and the national average rate increased for the fifth consecutive week. Key van markets:
—Los Angeles: $2.32/mile, up 3 cents compared with the previous week. The average outbound rate has risen 5.2% over the past four weeks
—Dallas: $2.08/mile, up 5 cents
—Memphis: $2.68/mile, up 6 cents
After a 5.6% advance in load volume the previous week, flatbed freight availability jumped 7% while capacity retreated 7.5%. The flatbed load-to-truck ratio climbed 16% to 101.5 the week ending March 31 and has risen steadily since November, when it was as low as 26.
Rates are derived from DAT RateView, which provides real-time reports on prevailing spot market and contract rates, as well as historical rate and capacity trends.
For the latest spot market load availability and rate information, visit www.dat.com/trendlines.
