Spot rates maintain downward direction heading into February
National average spot truckload rates continued to decline as the number of available loads slipped nearly 6% during the week ending February 3, 2018, said DAT Solutions, which operates the DAT network of load boards.
The number of truck posts increased 3%, which helped push refrigerated and dry van load-to-truck ratios down to near mid-December levels, before the mandate on electronic logging devices took effect:
•Reefers—10.2 loads per truck
•Vans—6.9 available loads per truck
•Flatbeds—61.1 loads per truck
Reefer load posts fell 19% and truck posts climbed 2%. Prices remain high even though rates on most high-traffic lanes were down. Long-haul lanes from the southern border took big steps back, including McAllen TX-Elizabeth NJ (down 51 cents to $2.76/mile) and Nogales AZ to Brooklyn NY (down 79 cents to $2.43/mile).
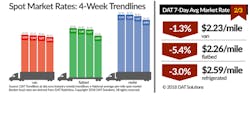
National average rates dropped 8 cents for reefers ($2.59/mile), 3 cents for van freight ($2.23/mile), and 13 cents for flatbeds ($2.26/mile). The price of diesel rose again, with the national average up 1.6 cents to $3.09/gallon.
Heading into what is traditionally a slow month, the number of van loads posted declined 16% and truck posts advanced 4%. Van rates were down in nearly every major market, although prices are higher than they were a year ago. Chicago’s outbound average had the sharpest decline the week ending February 3, sinking 16 cents to $2.77/mile after a 15-cent drop the previous week. Elsewhere:
•Houston, $2.00/mile, down 6 cents
•Memphis, $2.54/mile, down 1 cent
•Los Angeles, $2.32/mile, down 9 cents
•Columbus OH, $2.29/mile, down 8 cents
Spot prices for flatbed freight remain solid amid improved demand for capacity. Load posts increased 13% and truck posts decreased 2%; the 61.9 load-to-truck is the second highest flatbed load-to-truck ratio seen in years.
Rates are derived from DAT RateView, which provides real-time reports on prevailing spot market and contract rates, as well as historical rate and capacity trends.
For the latest spot market load availability and rate information, go to www.dat.com/industry-trends/trendlines.
