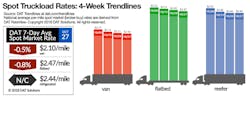
Spot truckload totals, load-to-truck ratios advance slightly
Slight increases in the number of loads and trucks posted on the DAT network of load boards helped slow the downward roll of spot truckload rates during the week ending October 27, 2018, a signal that pricing may be firming up ahead of the holiday shipping season.
National average load-to-truck ratios:
•Refrigerated freight—6.1 loads per truck, up slightly compared with the previous week
•Van freight—4.7 loads per truck, unchanged from the previous week
•Flatbed freight—17.2 loads per truck, declining seasonally and well below the 25.5 monthly average for September
National average spot truckload rates:
•Reefer— $2.44/mile, unchanged
•Van—$2.10/mile, down 1 cents
•Flatbed—$2.47/mile, down 2 cents
After two months of increases, the national average price of on-highway diesel fell for the second straight week, down 2.5 cents to $3.35 per gallon. Spot rates include a fuel surcharge portion.
The number of reefer load posts on DAT load boards rose 2% the week ending October 27 while truck posts advanced less than 1%. Outbound traffic and rates were up at gateways for imports from Mexico, including McAllen TX ($2.14/mile, up 5 cents).
Florida reefer markets are suffering after Hurricane Florence and several key lanes paid less the week ending October 27: Lakeland FL to Charlotte lost 19 cents at $1.25/mile, and Miami to Baltimore tumbled 31 cents to $1.51/mile.
The number of van load and truck posts were nearly unchanged the week ending October 27, and rates were lower on 60 of the top 100 van lanes.
Demand for vans remains strong on the West Coast and boosted load-to-truck ratios in California, Oregon, Idaho and Utah. This trend repeats every year as consumer goods from Asia arrive at the ports and move east.
Expect the capacity pressure in California to continue in November after a typhoon in Southeast Asia delayed ships bound for the Ports of Los Angeles and Long Beach, the arrival point for 49% of Asian imports. Outbound loads outnumbered available trucks in Los Angeles by more than 10 to 1 recently, lifting rates on lanes to Chicago, Dallas, Phoenix and Denver.
DAT Trendlines are generated using DAT RateView, a service that provides real-time reports on prevailing spot market and contract rates, as well as historical rate and capacity trends. RateView’s database is comprised of more than $57 billion in freight payments. DAT load boards average 1 million load posts per business day.
For the latest spot market load availability and rate information, visit http://dat.com/trendlines.
