On top of that, gasoline fuel prices are expected to remain low this summer – won’t that be a welcome development for everyone’s wallet – though spending on gasoline will vary widely across the different regions of the country, EIA added.
So let’s look at some numbers:
- Projected consumption of distillate fuel, which includes diesel fuel and heating oil, is expected to average four million barrels per day (bbl/d) this summer, up 120,000 bbl/d or 3% from the summer of 2014.
- During the 2015 “summer driving” season – ranging from April through September – EIA projects motor gasoline consumption will average 9.2 million bbl/d, an increase of 140,000 thousand bbl/d or 1.6% over the summer of 2014. The agency noted that year-over-year increases in summer highway travel, projected to be 2.5%, are being offset by a 0.9% increase in fleet-wide vehicle fuel efficiency improvements.
- EIA expects refinery output of distillate (again, diesel’s “feedstock” source) will average five million bbl/d this summer, up 30,000 bbl/d from last summer. The production of biodiesel is expected to average 85,000 bbl/d this summer, almost unchanged from 2014.
- The agency expects that domestic refinery production, including gasoline output, will increase by almost 100,000 bbl/d from last summer. Fuel ethanol blending into gasoline is projected to decrease by 10,000 bbl/d from last summer's level to 880,000 bbl/d, which is 9.6% of total gasoline consumption.
- Interestingly, EIA believes total gasoline net imports (including blending components) will average 210,000 bbl/d this summer, up 23% compared to the same “driving season” in 2014.
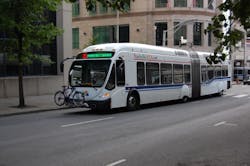
In another interesting report, EIA dug into household spending trends on gasoline and public transit, which not only varies significantly across regions but are often the reverse of each other.
In 2013, the most recent year of data from the U.S. Bureau of Labor Statistics' Consumer Expenditure Survey (CES), the average household spent $3,148 annually on gasoline and public transit, the agency noted, with only about a $200 difference between geographic regions with the highest and lowest travel expenditures.Differences across income levels are much greater, as households in the highest-income brackets spent almost four times as much on recurring travel expenditures as those in the lowest-income bracket, EIA said.
Yet regional differences in gasoline expenditures are almost the reverse of regional spending on public transit, the agency noted.
The South, which stretches along the Atlantic Coast from Delaware to Florida, and east to Texas and Oklahoma, tends to spend more than any other region on gasoline each year, according to EIA’s numbers.
On the other hand, the South spends the least on public transit, while in the Northeast, the reverse is true as that region spends the most on public transit yet the least on gasoline.
Higher expenditures on gasoline tend to reflect the number of vehicles per household, as households in the South have an average of 2.1 vehicles per household (slightly more than the national average of 1.9), while households in the Northeast average 1.6 vehicles, EIA pointed out.
In terms of public transportation ridership, the Northeast is home to several of the largest mass transit and light rail systems in the United States (for example, the New York City Subway and the Massachusetts Bay Transit Authority systems) as well as extensive commuter railroad networks.
Only a few cities in the South – such as Washington D.C., Atlanta, Miami, and Baltimore – offer rapid transit systems that serve at least 10 million riders annually.
Here’s a final data point from EIA’s number crunching: With relatively little change in consumption, gasoline expenditures tend to track gasoline prices (and therefore crude oil prices) while public transit expenditures, which reflect ridership and fares, tend to fluctuate much less year-to-year.
Something to think about as the weather gets warmer and more four-wheelers start hitting the road.


