The number of spot truckload freight posts jumped 18% during the week ending Jan. 5, outpacing the 11% gain in the number of truck posts, said DAT Solutions, which operates the DAT network of load boards.
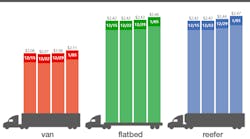
Tighter capacity led to a 3-cent increase in the national average spot rates for dry van, reefer, and flatbed freight. The trend may be brief, however, as lower fuel surcharges and weaker rates on many high-traffic lanes may impact rates.
Van trends: The number of van load and truck posts increased 11% compared to the previous week, which included the Christmas holiday. The load-to-truck ratio was unchanged at 8.9 loads per truck last week.
Rates moved higher on 41 of the top 100 van lanes while prices fell on 53 lanes. The other six held steady. The three largest lane-rate increases were out of Denver:
- Denver to Albuquerque jumped 28 cents to $2.35/mile
- Denver to Oklahoma City gained 21 cents to $1.41/mile
- Denver to Chicago added 20 cents to $1.52/mile
Denver is a big beer-producing market, with large-production breweries and craft brewers shipping beer in vans and reefers. It's possible that NFL playoff games and college bowl games increased demand from bars, restaurants, and grocery stores.
Elsewhere, average outbound rates from major van markets drifted lower after a strong week to close the year. Among them:
- Los Angeles: $2.61/mile, down 2 cents
- Memphis: $2.32/mile, down 3 cents
- Atlanta: $2.25/mile, unchanged
- Philadelphia: $2.01/mile, down 7 cents
- Columbus, Ohio: $2.48/mile, down 4 cents
Flatbed trends: The number of flatbed load posts soared 60% after a 44% fall the previous week. Truck posts rose 24%, which helped push the national flatbed load-to-truck ratio from 26.1 to 33.7 loads per truck.
Reefer trends: Reefer load-posting volume was unchanged last week while capacity increased 8%. The reefer ratio dropped to 9.8 loads per truck.
Among the top reefer lanes, 24 moved higher and 46 were lower. One of the hottest markets is Nogales, Arizona, led by Nogales to Dallas (up 61 cents to $3.38/mile) and Nogales to Brooklyn (a 44-cent increase to $3.08/mile).
DAT Trendlines are generated using DAT RateView, which provides real-time reports on spot market and contract rates, as well as historical rate and capacity trends. The RateView database is comprised of more than $57 billion in freight payments.
DAT load boards average 1 million load posts per business day.


