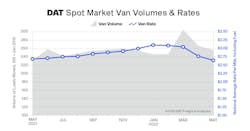
Truckload freight volumes declined for the third straight month in May and the average rate to move dry van freight on the spot market dipped below $2 per mile, excluding fuel surcharges, for the first time since July 2020, according to a monthly report from DAT Freight & Analytics.
DAT’s Truckload Volume Index (TVI) in May for dry van freight was 256, 3.7% lower compared to April, while the research firm’s refrigerated TVI was 190, also down 3.7% month-over-month. The flatbed volume index was 240, a 4.8% increase, according to a June 22 release from DAT.
See also: Spot rates fall as load posts rise and capacity tightens
Year-over-year, the May TVI was 10% higher for van freight, 11% higher for reefers, and 29.7% higher for flatbed loads, according to the DAT release.
Demand for truckload services was strong relative to May 2021, and the overall number of loads on the spot market increased. However, shippers are seeing better routing guide compliance as carriers cover more freight under contract compared to the same period last year.
Spot load-posting activity increases 14% while rates fall
Compared to April, there were 14% more loads posted in May as seasonal retail goods, fresh produce, construction materials, and other freight moved through supply chains. Truck posts declined 2.3%, according to the release from DAT.
The national average van load-to-truck ratio increased from 3.4 in April to 4.4 in May, meaning there were 4.4 loads for every van on the DAT One network. The ratio was the second highest on record for May. The reefer load-to-truck ratio was 7.5, up from 6.3, while the flatbed ratio fell from 64.5 to 63.3.
National average spot van and reefer rates fell 7 cents, however, to $2.69 per mile, equal to the May 2021 average. The spot reefer rate was $3.06 per mile, down 7 cents, and the flatbed rate added 3 cents to $3.44 per mile.
See also: More data sees TL volumes in retreat, spot market in freefall
Spot rates are negotiated by the carrier and freight broker as one-time transactions and should incorporate an amount to help cover the carrier’s fuel expense based on diesel prices at the time. Surcharges in May averaged 72 cents a mile for van freight, 79 cents a mile for reefers, and 86 cents a mile for flatbed freight.
“Demand for truckload services was solid last month, even on the spot market, where the number of available loads has fallen throughout the year,” said Ken Adamo, DAT's chief of analytics. “There were more than 1 million dry van loads on the DAT One network during each week in May, which has happened only once, in 2021.”
He added: “However, the price of diesel fuel continued to put downward pressure on spot truckload rates and cause small carriers to be discerning about the loads and terms they accept. We expect this volatility to continue through June.”
The DAT Truckload Volume Index is produced by DAT iQ and reflects the change in the number of van, refrigerated, and flatbed loads moved with a pickup date during a given month. Index numbers are normalized each month to accommodate any new data sources without distortion. Baseline of 100 equals the number of loads moved in January 2015.
Rates are derived from RateView, DAT’s database of $124 billion in annualized freight transactions, and include over-the-road lanes with lengths of haul of 250 miles or more. Spot rates represent the payments made to carriers by freight brokers, third-party logistics providers, and other transportation buyers. Contract rates are paid by the shipper to the carrier.
About the Author
FleetOwner Staff
Our Editorial Team
Kevin Jones, Editorial Director, Commercial Vehicle Group
Josh Fisher, Editor-in-Chief
Jade Brasher, Senior Editor
Jeremy Wolfe, Editor
Jenna Hume, Digital Editor
Eric Van Egeren, Art Director

