The spot market’s average linehaul rates for the dry van and refrigerated markets made some of the best year-over-year comparisons in the last two years. The measure of freight volume hauled among the spot and contract markets was mixed. Unemployment in transportation reached its highest rate since February 2022.
Here are some of July’s key metrics on average spot freight rates, overall freight volumes, and transportation unemployment.
Spot rates reach year-over-year milestone
For DAT Freight & Analytics, July was another month for milestone comparisons in spot market rates.
“The pricing environment for carriers showed signs of improvement,” Ken Adamo, DAT’s chief of analytics, said. “National average dry van and reefer spot linehaul rates in July were not year-over-year negative for the first time in 27 months.”
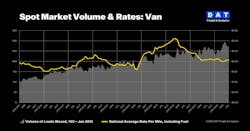
National average spot linehaul rates on DAT One for July were flat year over year for dry van and refrigerated loads, but down for flatbed.
The average dry van linehaul rate was $1.63 per mile, down 1 cent from June but flat year over year. The average refrigerated rate was $1.98, down 1 cent month over month but up 1 cent year over year. Flatbed rates suffered the most, with the average dropping to $1.97, down 5 cents from June and down 6 cents from a year prior.
See also: Industry analysts on what election means for trucking
The finding complements hopeful news from June’s average spot truckload rates. Last month, DAT found several days where rates were year-over-year positive for the first time in over two years.
Alongside the hopeful news for rates, DAT found that its measure of the spot truckload market’s load-to-truck ratio had increased year over year for all three measured equipment types. A higher load-to-truck ratio brings upward pressure on rates.
In DAT One for July, dry van’s ratio was 4.2, down from 4.7 in June but significantly up from 3.6 in July 2023. The refrigerated ratio was 6.5, down from 7.0 last month but up from 5.4 last year. Flatbed’s ratio was 11.9, down from June’s 14.6 but up from July 2023’s 9.4.
Mixed findings for freight volumes
DAT’s measure of spot market freight volumes hauled saw significant year-over-year gains. The American Trucking Associations’ measure, however, was less optimistic.
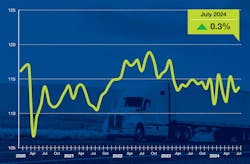
ATA’s Truck Tonnage Index found a slight decrease in freight volumes in July, down both month over month and year over year. The index measures seasonally adjusted for-hire freight volumes based on ATA member surveys, primarily representing contract freight and some spot market freight.
The ATA Truck Tonnage Index for July was 113.7, down 0.9% from June’s index score and down 0.6% from July 2023.
“While July wasn’t a strong month, we see continued evidence that the truck freight market is likely turning a corner, albeit slowly,” Bob Costello, ATA’s chief economist, said. “Some of July’s small gain was likely due to strong import activity, especially at West Coast seaports. Decent retail sales and factory output growing slightly from a year earlier also helped truck tonnage last month.”
On the other hand, DAT found that spot truckload freight volumes performed well in July. The firm saw a second straight month of stable volumes, up almost 10% from July 2023.
DAT’s Truckload Volume Index increased for all three measured equipment types: Dry van’s TVI increased nearly 10% year over year, the refrigerated TVI increased 13%, and the flatbed TVI rose 4%.
“Near-record container imports and weather-related supply chain disruptions helped drive loads to the spot market at a time when available capacity tightened,” DAT’s Adamo said.
Rising unemployment in transportation
Unemployment in transportation rose in July and was higher than the U.S. total unemployment rate, according to the Bureau of Transportation Statistics.
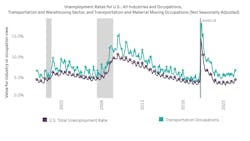
The Bureau’s Unemployment in Transportation dashboard found that its transportation unemployment rate, measuring unemployment among people primarily from transportation or material-moving occupations, rose to 6.8%. This rate is noticeably higher than the U.S. total unemployment rate for July, which was 4.5%.
The 6.8% transportation unemployment rate is only 0.1 percentage points above June’s rate but 1.1 percentage points higher than July 2023’s. It is the highest BTS transportation unemployment rate since February 2022, when the rate spiked to 6.9%.
The BTS transportation unemployment metric doesn’t perfectly capture unemployment for for-hire trucking; it also represents the other modes of transportation and fails to account for sole proprietors, such as owner-operators.
About the Author
Jeremy Wolfe
Editor
Editor Jeremy Wolfe joined the FleetOwner team in February 2024. He graduated from the University of Wisconsin-Stevens Point with majors in English and Philosophy. He previously served as Editor for Endeavor Business Media's Water Group publications.


