Which World Cup host cities face the worst truck traffic congestion?
Key takeaways
- Gillette Stadium ranks highest in preparedness, with excellent congestion management and containment ratios, making it the most traffic-ready host city.
- Canadian cities like Vancouver and Toronto show lower preparedness scores, mainly due to congestion and safety concerns.
- The analysis emphasizes the importance for travelers and logistics providers to plan routes carefully around event days to avoid delays and disruptions.

The World Cup soccer tournament begins today in North America. Sixteen cities—12 in the U.S., two in Canada, and two in Mexico—will experience the excitement of the world stage as they host international matches over the next several weeks. But that excitement comes at a cost. These events put pressure on road networks, disrupting everyday traffic, deliveries, and long-haul transport.
Transportation technology provider Geotab analyzed traffic data across all 16 host cities to determine which cities will fare best and which will be most negatively impacted by the surge in gameday traffic. Geotab then ranked the cities on a scale of 10, with 10 indicating the most prepared and 1 indicating the least prepared for World Cup traffic.
To rank host city preparedness, Geotab used data from the weekdays in June and July 2025 as a baseline, comparing four components—congestion, idle time, safety, and resilience—to produce a final ranking for each host city. The data is relegated to a 3-mile stadium area radius and a 12.5-mile metro area radius.
Here are the results.
Road networks in these host cities are the most prepared for World Cup traffic
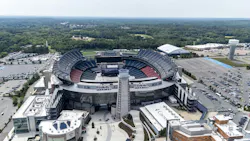
1. Gillette Stadium in Foxborough, Massachusetts (Boston Metro): 8.01
Gillette Stadium is designed to handle gameday traffic. Home of the New England Patriots, the stadium is quite isolated, surrounded only by parking lots. This fact “explains almost everything in its score,” Geotab states.
Its congestion score (0.964) is close to perfect, as traffic runs the speed limit for 22 of 24 hours each day. This is the most of any stadium, according to Geotab data. There is typically no chronic freight backup, and the estimated median idle time per vehicle is about 25 minutes per day.
Gillette Stadium also provides a master class on gameday traffic containment, with a containment ratio of 10.80, which is the best ratio in Geotab’s data by a wide margin. Gameday traffic rarely breaches the 3-mile stadium zone, as most traffic congestion stays within the parking lots.
Gillette Stadium could use some work on its safety score, though. The proximity to Interstate 95 and Route 1, which have high posted speed limits, keeps the city’s safety score at 0.669.
Foxborough’s ability to keep a resilient road network is solid, at 0.617. “The stadium infrastructure was built around events from day one; freight and fans don’t share the same corridors in a meaningful way,” Geotab stated in its report.
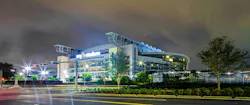
2. NRG Stadium in Houston, Texas: 7.66
Freight haulers know that Houston is a busy corridor, but overall, it gets an efficient score. Even better, World Cup traffic from NRG Stadium shouldn’t negatively impact Houston’s road networks. NRG Stadium, home of the Houston Texans, sits near the US-59 and I-610 interchange, where, on a normal weekday, congestion sits at 0.879—a strong score. Geotab said this reflects Houston’s “sprawling low-density development and surplus road capacity.”
Shining bright where Gillette Stadium was dull, NRG Stadium’s safety score of 0.762 is the second-best of any stadium across the dataset (behind only Estadio Azteca). This could be attributed to Houston’s low pedestrian density and wide roads.
NRG Stadium’s road network resilience is 0.567, which is “above average, but not exceptional,” according to Geotab. While the stadium is not as isolated as Gillette Stadium, it hosts events regularly, and traffic patterns have adjusted over time, using alternate routes efficiently.
Idle time around NRG Stadium is moderate at about 36 minutes per vehicle per day.
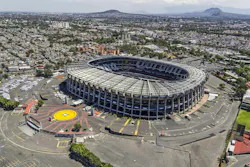
3. Estadio Azteca in Mexico City: 7.29
What brings Estadio Azteca’s score up is its perfect road network resilience score: a perfect 1.000. But what keeps it from being crowned the city most prepared for World Cup traffic is its terrible congestion score: 0.439, which ranks it 14th among the 16 host cities.
Traffic flow around Mexico City is the culprit for Estadio Azteca’s bad congestion score, as vehicles get up to the posted speed limit for only a few hours each day. What allows the stadium to have a great resilience score, however, is its proximity to the Anillo Periférico, a ring highway that handles the bulk of freight traffic through Mexico City and that is largely unaffected by stadium traffic.
Estadio Azteca’s safety score is also high at 0.801, the second-best in the dataset, and “surprisingly high for a dense megacity,” Geotab states, likely due to the “driving style and road geometry.” The stadium’s idle ranking is 8.3, similar to NRG Stadium's.

Road networks in these host cities are the least prepared for World Cup Traffic
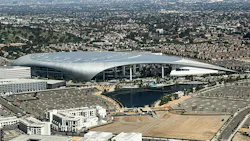
14. SoFi Stadium in Los Angeles, California: 4.76
Los Angeles can’t handle event traffic, according to Geotab data. SoFi Stadium has the worst road network resilience score (0.93) of any stadium on the list, and when events happen, traffic can’t be contained. It seeps into L.A. roads, highways, and metro areas, giving the city a containment ratio of 1.89.
Congestion is another big problem (5.35). L.A.’s 3-mile radius around SoFi Stadium has only 9 hours of flowing traffic per day (that’s compared to Gillette Stadium’s 22 hours). Secondly, SoFi Stadium is located in a dense urban area with heavy traffic, regardless of the events held there.
SoFi Stadium’s safety and idle scores aren’t terrible, however, at 5.6 and 8.3, respectively.

15. BC Place in Vancouver, British Columbia, Canada: 4.46
Vancouver and BC Place Stadium aren’t ready for the World Cup in terms of road network preparedness.
BC Place has the worst safety score in the dataset, at 2.0. Geotab attributes this to Vancouver’s harsh acceleration rates (4.38 per 1,000 travelers within the 3-mile stadium radius) and harsh braking rates (4.06 per 1,000 travelers within the 12-mile radius). Geotab believes these rates are due to BC Place’s location in a downtown, urban area with heavy pedestrian traffic, traffic lights, and a dense population.
Congestion in the area also received a low score at 5.9. However, Geotab found that the wider 12.5-mile radius around the stadium is more resilient to event traffic, with a resilience score of 7.2. In contrast, the 3-mile radius around the stadium isn’t likely to recover quickly, with a resilience score of 0.55.
The nail in the coffin for BC Place’s second-to-last ranking is the idle score at 7.3, meaning vehicles sit idle for about an hour each day.
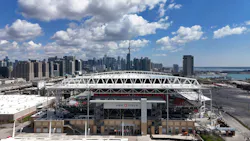
16. BMO Field in Toronto, Ontario, Canada: 3.99
Traffic management isn’t the best in Canada; perhaps it’s because Canadians are too polite. The city least prepared for World Cup traffic, according to Geotab data, is Toronto.
While they didn’t rank last in everything—three cities ranked lower in safety, one in idle time, and three in resilience—Toronto’s main problem is congestion, which ranked the lowest at 3.9. For comparison, its congestion score is a full two points lower than Vancouver’s. This low congestion score is likely due to the stadium’s location, a “waterfront zone with limited entry/exit vectors and no direct highway access,” Geotab described. It’s also embedded in downtown traffic patterns and susceptible to everyday city traffic.
Toronto ranks 4.0 in safety and 7.2 in idle, which is higher than some on the list, but not high enough to balance its congestion score.
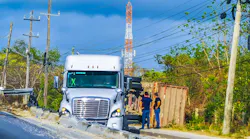
Tread lightly on World Cup match days
There isn’t a single trucker on the road who is new to bad traffic, but those traveling in these cities—and the other host cities on Geotab’s list—should be aware of the World Cup tournament schedule and plan their routes accordingly.
FIFA World Cup 2026 host city traffic congestion rankings
How well can each host city’s freight network handle the 2026 tournament? Here is how Geotab data ranked the traffic around the stadiums from best to worst:
- Gillette Stadium, Foxborough, Massachusetts
- NRG Stadium, Houston, Texas
- Estadio Azteca, Mexico City, Mexico
- AT&T Stadium, Arlington, Texas
- Arrowhead Stadium, Kansas City, Missouri
- Levi’s Stadium, Santa Clara, California
- Hard Rock Stadium, Miami Gardens, Florida
- Estadio Akron, Guadalajara, Mexico
- MetLife Stadium, East Rutherford, New Jersey
- Lincoln Financial Field, Philadelphia, Pennsylvania
- Estadio BBVA, Monterrey, Mexico
- Mercedes-Benz Stadium, Atlanta, Georgia
- Lumen Field, Seattle, Washington
- SoFi Stadium, Los Angeles, California
- BC Place, Vancouver, British Columbia
- BMO Field, Toronto, Ontario
About the Author

Jade Brasher
Executive Editor Jade Brasher has covered vocational trucking and fleets since 2018. A graduate of The University of Alabama with a degree in journalism, Jade enjoys telling stories about the people behind the wheel and the intricate processes of the ever-evolving trucking industry.