Trucking By the Numbers 2025 Overview: Carrier composition, costs, and impact
This is the first web gallery for FleetOwner's 2025 Trucking By the Numbers. Check out the full list of TBN 2025 galleries here.
The trucking industry remains a vital part of the U.S. economy.
However, the dynamics in this sector are ever-changing. Larger fleets are making up a greater count of the overall carrier population compared to previous years. On the other hand, large fleets are most likely to reduce their number of power units—a major factor is the ongoing freight recession, in which operational costs continue to rise while for-hire rates stagnate.
Despite the freight recession's headwinds, the overall narrative of today's trucking industry is similar to previous years: Small fleets account for most carriers, for-hire operations account for the majority of over-the-road hauls, and the costliest parts of those operations are fuel and drivers.
Truck transportation drives the U.S. economy
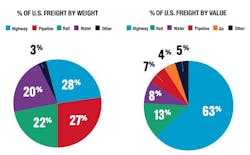
The latest measure of trucking's impact on the economy is the measure of goods moved by highway transportation in 2023 by the Bureau of Transportation Statistics.
According to BTS data, highway transportation moved 240 million tons of freight, worth $933 billion. Those hauls made up 63% of the nation's freight trade by value.
By weight however, trucking only makes up about 28% of the freight trade.
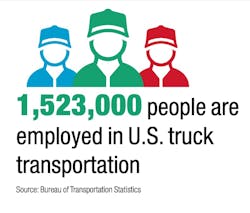
Trucking serves the entire U.S. population, but according to the Bureau of Transportation Statistics' industry classification system (NAICS 484), the for-hire trucking industry directly employs about 1.5 million people today. This BTS metric necessarily excludes private fleets, since private carriers are operated by firms with a different primary business.
Trucking is still mostly small carriers
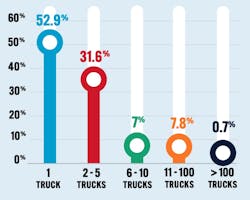
Commercial carriers continue to be mostly smaller operations. Single-truck fleets made up about 52.9% of registered carriers, according to the American Trucking Associations' latest Trucking Trends report. There are 91.5% of motor carriers operating 10 or fewer trucks.
Though small fleets have always been numerous, the statistics are a bit different from last year's Trucking By the Numbers: Larger fleets (10+ trucks) are now a larger part of the overall carrier population (without touching on truck populations). In the 2024 TBN, 1-truck fleets made up 66.2% of carriers, and 10-or-fewer-truck fleets made up 99.5% of registered carriers.
Carrier population: for-hire vs. private
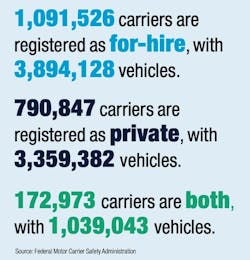
The populations of for-hire and private commercial vehicles on the roads today are fairly close. FMCSA's data reports about 3.9 million vehicles under for-hire carriers and 3.4 million vehicles under private carriers—while 1 million vehicles' carriers are registered as both for-hire and private.
However, the for-hire segment is much more fragmented than the private segment. Those 3.9 million for-hire vehicles are split among 1.1 million carriers, leaving about 3.6 vehicles per for-hire carrier. For private, the 3.4 million vehicles are shared among 790,847 carriers, leaving about 4.2 vehicles per private carrier.
Fleets are cutting their power units
While those high-level commercial carrier demographics are comparable to previous years' Trucking By the Numbers, fleet populations are far from stagnant.
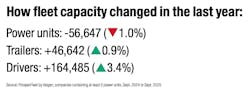
ProsperFleet by Valgen, the data service that helps FleetOwner compile the FleetOwner 500, also reported national trends among fleets' top-reported assets: power units, trailers, and drivers.
The results are interesting: When comparing the capacity of fleets (here defined as companies containing at least 5 power units), the number of trailers and drivers increased significantly, while the number of power units fell.
More granularly, larger fleets made greater capacity cuts, while smaller fleets' measure of capacity was less affected. The average size of fleets that increased their count was 36, while the average size of fleets that reduced their count was 58.
Rising for-hire operational costs
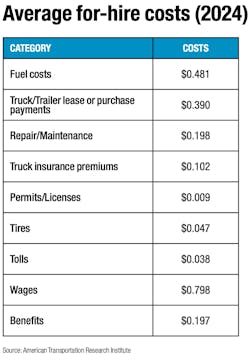
Of course, a major reason for the capacity fluctuations is the simple cost of doing business. The latest and most thorough report on operational costs today is the American Transportation Research's Institute's latest Operational Costs of Trucking report.
The latest Operational Costs of Trucking report analyzed 2024 operational costs using several public and private sources, as well as a wide-reaching voluntary data collection program. The data focuses on for-hire operational costs and doesn't include many miscellaneous overhead costs, such as office staff compensation.
The report found that the nation's latest average for-hire operating cost is $2.26 per mile, including fuel.
The largest operational costs were largely the same as previous years: fuel, equipment payments, and wages.
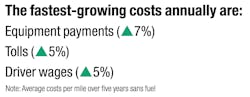
When comparing ATRI's measure of operational costs across the last five years, some expenses are growing faster than others. Not including fuel, the fastest-growing costs over the last few years were equipment payments, tolls, and driver wages.
Each of those costs grew about 5-7% annually, which was generally faster than annual inflation in the same timeframe.

About the Author

Jeremy Wolfe
Editor
Editor Jeremy Wolfe joined the FleetOwner team in February 2024. He graduated from the University of Wisconsin-Stevens Point with majors in English and Philosophy. He previously served as Editor for Endeavor Business Media's Water Group publications.