Trucking By the Numbers 2025: Economics
This is the third web gallery for FleetOwner's 2025 Trucking By the Numbers. Check out the full list of TBN 2025 galleries here.
The trucking industry supports the entire U.S. economy, moving 63% of the nation's freight by value. The economy also supports trucking: When people and businesses buy more things, trucks tend to move those things.
However, some parts of the economy support fleets more than others. The industry was still in the throes of a freight recession this year—a combination of excess capacity and weak demand. But what numbers defined freight demand?
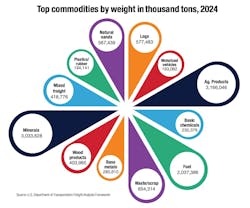
The top commodity categories moved by commercial vehicles, by weight, are as follows, according to the U.S. Department of Transportation's Freight Analysis Framework:
-
- Agricultural products
- Minerals
- Fuel
- Waste/scrap
A popular industry conception is that the sectors driving the most freight include manufacturing, retail, and construction. Here is how the economy's manufacturing numbers defined the trucking industry this year.
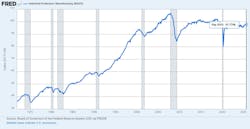
Manufacturing has remained flat for years
A very broad view of the state of manufacturing comes from the Federal Reserve.
The index below shows a measure of manufacturing output as a whole since 1972. The metric has barely grown since 2005. The index last surpassed 2017's score in March 2019—meaning the last six years of manufacturing output here have been nearly flat. The latest score is below 2017 levels, at 97.8.
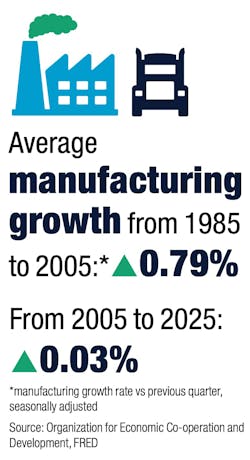
One more metric for manufacturing growth: a measure of the quarterly (and seasonally adjusted) growth of manufacturing volumes in the U.S., from the Organisation for Economic Co-operation and Development (OECD). The previous FRED chart suggested that overall manufacturing has barely nudged since 2005. This OECD data tells the same story in a different way.
From 1985 to 2005, manufacturing output grew, on average, 0.79% each quarter. From 2005 to 2025, the growth rate was minuscule: 0.03% each quarter.
Trucking indexes better reflect freight demand
The issue with watching manufacturing as a whole, however, is that it isn't quite representative of freight demand for trucking. The data might overrepresent sectors that move smaller quantities of high-value goods, such as semiconductors and pharmaceuticals.
Supply chain professor Jason Miller recently wrote a great (and accessible) explanation of this on LinkedIn, including a version of the line chart that excludes the electronics and pharmaceuticals sectors. Miller also regularly shares a trucking ton-mile index on social media that more appropriately captures freight demand.
Plenty of industry groups share their own indexes to measure trucking-appropriate freight demand, including the American Trucking Associations' Truck Tonnage Index and the ACT Research For-Hire Trucking Volumes Index, to name only two.
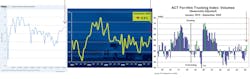
Comparing similar industry freight indexes to the FRED manufacturing score for September of this year, we see that each index had a noticeably different takeaway for month-over-month seasonally adjusted freight demand.
ATA's and ACT Research's indices are both based on carrier surveys. ATA says its survey better represents contract freight than spot freight and its index score is based on 2015's results. ACT's index score is a degree of respondents' recent freight volume change, either deterioration (below 50) or improvement (above 50).
The Federal Reserve's data noted that overall manufacturing in September was relatively flat from August. ATA noticed a slight drop in September right after a substantial increase in August. ACT Research's index suggested that conditions improved.
Among these graphs, a general takeaway for goods moved since the pandemic remains the same: 2021 and 2022 had strong fluctuations, but activity since has been sluggish.
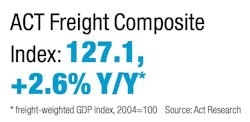
ACT Research also produces a proprietary freight-weighted GDP Index, the ACT Freight Composite Index. This recent score (127.1, up 2.6% year over year) is also for September.
This index makes many modifications to the gross domestic product data from the Bureau of Economic Analysis to isolate freight-generating activity, such as emphasizing durable goods and adding (instead of subtracting) many imports.


About the Author

Jeremy Wolfe
Editor
Editor Jeremy Wolfe joined the FleetOwner team in February 2024. He graduated from the University of Wisconsin-Stevens Point with majors in English and Philosophy. He previously served as Editor for Endeavor Business Media's Water Group publications.