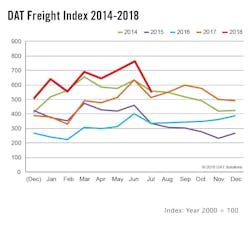
July spot truckload volumes return to typical summer levels: DAT
Spot market freight availability dropped sharply in July, returning to typical seasonal levels after an all-time peak in June, according to DAT Solutions, which operates North America’s largest load board marketplace and DAT Freight Index, a monthly indicator of spot market trucking.
Spot truckload freight volume fell 29% month-over-month but increased 3.4% compared to July 2017. The decline brings freight levels in line with July volumes in 2017 and 2014, the previous record-holders on the DAT Freight Index.
"Spot market rates did not drop as much as we would expect in July,” said Mark Montague, pricing analyst at DAT. “Going forward, rate trends are likely to follow a normal seasonal pattern but at a level that’s 25% to 30% higher than in 2017."
Compared to June, the national average spot van rate fell 2 cents to $2.29 per mile, while the flatbed rate slid 5 cents to $2.77. Rates for refrigerated (“reefer”) equipment dropped steeply, down 9 cents to $2.61 per mile, as produce season wound down in California.
Spot reefer and flatbed rates both exceeded the comparable contract rates. The average contract reefer rate rose 3 cents to $2.59 per mile while the contract flatbed rate lost 5 cents to $2.73.
Compared to July 2017, the average spot rate for van equipment was 51 cents per mile higher last month, the reefer rate was up 54 cents, and the flatbed rate was 60 cents higher.
Referenced rates are the averages by equipment type, based on $57 billion of actual transactions, as recorded in DAT RateView. Reference rates per mile include fuel surcharges, but not accessorials or other fees. The DAT Freight Index reflects load posting volume on the DAT network of load boards, and 100 on the Index represents the average monthly volume in the year 2000.
About the Author
Fleet Owner Staff
Our Editorial Team
Kevin Jones, Editorial Director, Commercial Vehicle Group
Cristina Commendatore, Executive Editor
Scott Achelpohl, Managing Editor
Josh Fisher, Senior Editor
Catharine Conway, Digital Editor
Eric Van Egeren, Art Director


