Omicron creates roller coaster of the freight market

U.S. freight capacity remains fragile this winter, according to Cass Transportation’s latest report. As the COVID-19 omicron variant wave has started to subside and conditions briefly started to ease in late January, winter weather and events in Canada were enough to press spot truckload rates back above trend in early February.
In addition to freight carriers, the manufacturing sector, which had recently started to show signs of easing in the everything shortage, is grappling with significant absenteeism. While expected, automotive downtime announcements increased in February, but Cass reports that omicron’s needle shape suggests the effects will be brief and set up a springtime rebound.
See also: Trucking markets poised to build off strong 2021 finish
The omicron variant's widespread nature has had a major impact on the economy’s productive capacity, and freight-moving capacity in particular. And while, like each variant before it, omicron is making a longer-term imprint on the economy, its quick decline suggests the worst is past.
Shipments
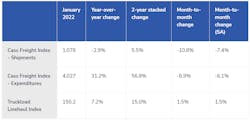
U.S. freight volumes reeled in January from the surge in omicron cases, with the shipments component of the Cass Freight Index down 10.8% from December and down 2.9% year-over-year.
“The 7.4% month-over-month (SA) drop in January in the shipments component of the Cass Freight Index is about as good an answer as we have to the question of how big an impact omicron-related absenteeism and quarantines had on the freight economy,” the report stated. “While these effects are lingering in February, they are beginning to fade and we expect a rebound in the coming months as case counts fall sharply.”
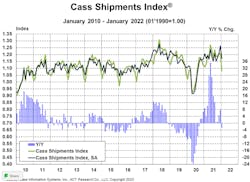
According to the report, this was not a demand-driven decline, as inventories are still lean and consumer balance sheets strong. Though the backlog of containerships off Southern California was down to 78 as of February 9th from a peak of 109 a month earlier, per MX SoCal, backlogs have been growing at several other ports, particularly Houston, Charleston and Virginia, causing yet another setback on the supply side.
Expenditures
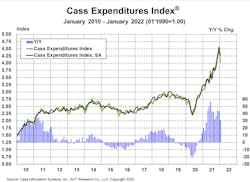
The expenditures component of the Cass Freight Index, which measures the total amount spent on freight, fell 8.9% month-over-month in January to 4.027 from a record level of 4.419 but was still up 31% year-over-year.
According to Cass, on an SA basis, expenditures fell 6.1% month-over-month, more than explained by the 7.4% month-over-month drop in shipments, as rate increases continued. On a two-year stacked basis, the expenditures component of the Cass Freight Index was up 57% in January, with shipments up 6% and rates up 49%.
This index rose 38% in 2021, after a 7% decline in 2020 and no change in 2019. Tougher comparisons in the coming months will naturally slow these year-over-year increases, but just using normal seasonality from here, the increase in 2022 will still be about 20% at this omicron-pressured trend level.
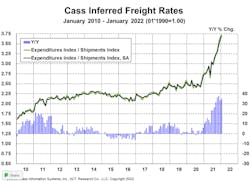
Inferred freight rates
A simple calculation of the Cass Freight Index data (expenditures divided by shipments) produces a data set of inferred freight rates that explains the overall movement in cost per shipment.
“The freight rates embedded in the two components of the Cass Freight Index accelerated to a 35% year-over-year increase in January from 33% in December,” the report stated. “Cass Inferred Rates rose 3.0% month-over-month on a seasonally adjusted basis in January, to a new record.”
With significant negative effects on transportation capacity, omicron has added to inflationary pressure in freight markets. But the strong January BLS employment report suggests most of these effects are temporary and related to absenteeism, which has been widespread across fleets and factories.
As the railroads continue to struggle, excess miles in the freight network are persisting, which also adds to these costs. Chassis production has improved considerably for the past six months, but only enough to turn the direction of the chassis fleet from contraction to slight growth, and the chassis fleet remains far from what is needed to address rail network congestion.
This tight intermodal offtake capacity continues to slow the network and press freight into the truckload market, particularly off the West Coast, raising the truckload length of haul (LOH) 20% year-over-year in January. Trucking continues to take share from a challenged rail network with intermodal volumes at risk of two straight quarters of double-digit year-over-year declines in Q4 2021 and Q1 2022.
Excess miles, rising fuel surcharges, and accessorial fees are also factors that are not reflected in the Cass Truckload Linehaul Index, so the true increase in freight cost, depending on how all of these factors shake out, is between the 7% year-over-year increase in the Cass Truckload Linehaul Index and the 35% year-over-year increase in the inferred rate.
After rising 23% in 2021, Cass Inferred Freight Rates are on a 20% trend for 2022 at this point, Cass reports. This data set is diversified among all modes, with truckload representing more than half of the dollars, followed by LTL, rail, parcel, and so on.
Truckload Linehaul Index
The Cass Truckload Linehaul Index rose 2.2 points in January to 150.2 from 148.0 in December, up 1.5% month-over-month and up just 7.2% year-over-year, slower than the 8.0% increase in December.
This data series trends below the ~20% increases in public TL fleet per-mile rates due in part to a large increase in length of haul (LOH) resulting from rail service issues pressing longer-haul shipments on the highways. Accessorial fees (which our index does not include) are also part of the difference, but we estimate a 3% mix effect from longer LOH in January, which reduces the rate per mile even as cost per shipment rises.
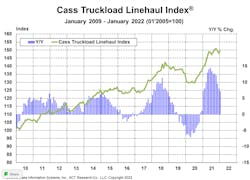
Strong freight demand and tight capacity are continuing to press this index higher, but its rise continues to be limited by mix. As intermodal network congestion gradually eases over the course of 2022, a reversal to shorter length of haul will likely add upward pressure to this index above and beyond market rate increases.
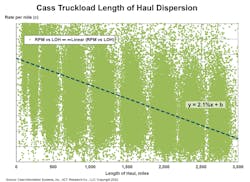
To demonstrate the effect of longer length of haul on truckload rates, the scatter plot below analyzes a sample of 27 million truckload shipments in the Cass data set. Though the data set is so deep it arguably needs at least another dimension, we can say from this simple linear model that every 100-mile increase in LOH historically results in about a 2.1% lower rate per mile.
In January, the LOH in the Cass truckload data set was about 131 miles longer year-over-year, so LOH reduced the Cass Truckload Linehaul Index by about 2.8% and mileage-neutral truckload rates rose more like 10% year-over-year.
About the Author
FleetOwner Staff
Our Editorial Team
Kevin Jones, Editorial Director, Commercial Vehicle Group
Josh Fisher, Editor-in-Chief
Jade Brasher, Senior Editor
Jeremy Wolfe, Editor
Jenna Hume, Digital Editor
Eric Van Egeren, Art Director