Trucking By the Numbers: Carriers keep getting safer
Key takeaways
- Large trucks were involved in 150,800 crashes and 4,330 fatalities in 2025; fatalities fell 13.7% from the prior year.
- In 2024, 55% of fatal truck crashes occurred on rural roads, and 70% happened on weekdays during business hours.
- Brakes and tires were the leading out-of-service inspection categories from January through September 2026.
- FMCSA recorded 58,117 Drug and Alcohol Clearinghouse violations in 2025; marijuana accounted for 66% of positive drug tests.
This is the first part of Trucking By the Numbers, FleetOwner's annual feature on the industry's most important and interesting metrics.
This year's Trucking By the Numbers sections are:
- Overview and economy: How big (and healthy) is the trucking industry?
- Operating costs and fuel: Combustion fuel's explosive prices
- For-hire vs. private fleets, drivers: Driver stats, for-hire vs private
- Safety, enforcement: Trucks keep getting safer
- Technology, equipment, tariffs: Coming soon
For most fleets, safety is always a top priority. That emphasis shows in the data: Large truck accident fatalities—and motor vehicle fatalities overall—are trending down.
Today's section of Trucking By the Numbers will take a look at some of the defining metrics in safety and enforcement:
Trucking accidents by the numbers
There's good news and bad news.
The bad news is, like usual, the number of crashes and fatalities:
Large trucks were involved in 150,800 crashes, 72,936 injuries, and 4,330 fatalities in 2025
This one comes from the Federal Motor Carrier Safety Administration's (FMCSA's) ever-handy Analysis & Information Crash Statistics page.
FMCSA continues to update these 2025 statistics: When the print issue of Trucking By the Numbers mailed out to readers in October, FMCSA estimated 786 fewer crashes, 203 fewer injuries, and 39 fewer fatalities in 2025.

920 large truck occupants fatally injured in 2024
According to the National Highway Traffic Safety Administration's (NHTSA's) Fatality and Injury Reporting System Tool, there were 920 large truck occupants killed in crashes in 2024.
NHTSA's tool only has data up to 2024. Compared to FMCSA's count of all 2024 fatalities involving large trucks (below), truck occupants accounted for 18% of all large truck fatalities.
 Blonde woman truck driver faces paperwork
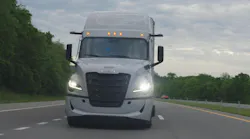 A Freightliner Cascadia
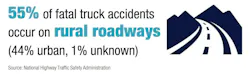
55% of fatal truck accidents occur on rural roadways
From NHTSA's 2024 Traffic Safety Facts, over half of fatal accidents involving large trucks happened on rural roads. Most crashes (70%) occurred on weekdays during business hours (6 a.m. to 5:59 p.m.). Only 25% of fatal truck crashes occurred on interstates.
6.5% of fatal truck accidents occur during rain
More NHTSA fatal crash data finds that, while precipitation may make roads slick, drivers handle the weather without much issue.
Only 6.5% of fatal truck crashes occur during rain. Assuming that rain falls over the average U.S. land about 8% of all time, rain doesn't seem to make roads particularly fatal for fleets.
The top 10% of risk-ranked drivers account for 47% of crashes.
According to Samsara's 2026 Compounding Risk Report, a fleet's riskiest drivers make an outsized contribution to its accident rate.
The top 10% of Samsara's risk-ranked drivers account for 47% of crashes. The top 30% account for 76% of crashes.
The most risk-associated behaviors according to Samsara are harsh braking, mobile usage, distracted driving, speeding events, and rolling stops.
Year over year, trucks in 2025 were involved in 5% fewer crashes, 3% fewer injuries, and 13.7% fewer fatalities.
The good news is that roadways continue to get safer. According to the FMCSA Crash Statistics, 2025 saw 13.7% fewer fatalities. That trend is likely to continue into 2026:
Overall motor vehicle deaths in 2026 are, so far, nearly 10% lower than in 2025 or 2024.
Estimates from the National Security Council's (NSC's) Injury Facts count nearly 10% fewer fatal accidents this year, even though miles traveled only decreased by about 1%. The Injury Facts data only has estimates up to August 2026 at this time.
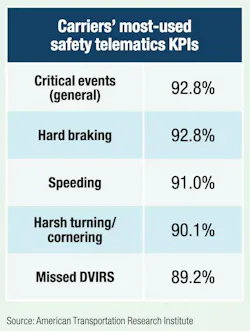
Most carriers track hard braking (92.8%) and speeding (91.0%) telematics events
The American Transportation Research Institute's (ATRI's) 2026 report on telematics, Trucking’s Use of Telematics Data to Improve Performance. includes a breakdown of the most-used safety telematics KPIs from a survey of 111 motor carrier survey participants.
Survey participants were also asked to rank the importance of certain safety KPIs. Carriers ranked driver distraction KPIs third in importance, but in actual use, driver distraction ranked closer to 10th place.
82% of drivers say tying pay or bonuses to safety scores would motivate them to improve their driving
While driver pay and retention bonuses continue to increase, fleets may be motivated to add safety bonuses to their list of payouts.
From the 2026 Fleet Safety Survey by Linxup, a survey of 267 commercial fleet drivers, 82% of drivers think safety bonuses might improve their driving.
Also from the survey: 77.2% say the benefits of safety technology outweigh privacy concerns, and nearly 44% say dashcams or GPS data helped someone they know in an accident dispute.
State and federal enforcement
Carriers continue working to make their operations safer—and government officials continue their work to enforce safety standards.
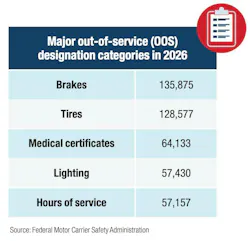
From January to September 2026, according to the FMCSA Analysis & Information page for inspection data, the top out-of-service (OOS) categories so far this year are:
- Brakes: 135,875
- Tires: 128,577
- Medical certificates: 64,133
- Lighting: 57,430
- Hours of service: 57,157
Over 40,000 OOS penalties for English proficiency since 2025
According to the same FMCSA inspection data, there have been around 48,004 out-of-service violations for 391.11B English proficiency since the crackdown in mid-2025. This only tracks violation codes under 391.11B that mention "English" under the violation description.
In 2025, personnel logged 22,200 English proficiency violations. In 2026 so far, personnel have logged 25,804 English proficiency violations.
58,117 Clearinghouse violations in 2025
From FMCSA's Drug & Alcohol Clearinghouse October 2026 report, the Clearinghouse recorded 58,117 violations in 2025. That was 8.5% fewer violations than the previous year.
So far in 2026, the Clearinghouse has recorded 46,083 violations.
Since it began counting in 2020, the Clearinghouse has found 411,747 total drug violations and 10,574 total alcohol violations. About 15% of total Clearinghouse violations occurred because the driver refused to test.
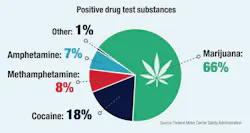
Among those drivers who took a test and failed in 2025, by far the most commonly identified substance was marijuana.
66% of positive drug tests found evidence of marijuana
The breakdown of the top substances (or metabolites) identified in failing tests was:
- Marijuana: 66%
- Cocaine: 18%
- Methamphetamine: 8%
- Amphetamine: 7%
- Other: 1%
Marijuana has the longest detection window of those top drugs, remaining detectable in urinalysis for one to 45 days. Interestingly, the second-most-detected drug, cocaine, has a relatively short detection window, remaining detectable for only one to two days.
About the Author
 Jeremy Wolfe
Editor
Editor Jeremy Wolfe joined the FleetOwner team in February 2024. He graduated from the University of Wisconsin-Stevens Point with majors in English and Philosophy. He previously served as Editor for Endeavor Business Media's Water Group publications.