Trucking By the Numbers: Driver stats, for-hire vs private
Key takeaways
- The Bureau of Labor Statistics estimates 2.2 million U.S. heavy and tractor-trailer drivers.
- ATRI reports 44.2% annual turnover across for-hire operations.
- Improving for-hire economics are raising driver pay this year.
- Private fleets reported 17.1% turnover and average annual driver pay of $93,528; about 58% of their drivers could go home every night.

This is the first part of Trucking By the Numbers, FleetOwner's annual feature on the industry's most important and interesting metrics.
This year's Trucking By the Numbers sections are:
- Overview and economy: How big (and healthy) is the trucking industry?
- Operating costs and fuel: Combustion fuel's explosive prices
- For-hire vs. private fleets, drivers: Driver stats, for-hire vs private
- Safety, enforcement: Coming soon
- Technology, equipment, tariffs: Coming soon
This section of Trucking By the Numbers 2026 is about drivers, especially how the shifting of for-hire and private fleet landscapes are changing their relationships with drivers.
There are a lot of carriers competing for the same pool of drivers—about 572,692 registered carriers run more than 1 truck, according to this earlier section of TBN. But there are a lot of truck drivers, too. About 2.2 million of them.

Trucking has 2.2 million drivers
According to the U.S. Bureau of Labor Statistics (BLS), the U.S. employed about 2.2 million heavy- and tractor-trailer truck drivers in 2025.
The BLS driver population is quite a bit lower than the Federal Highway Administration's count of registered tractor-trailers (3.5 million trucks).
BLS predicts the nation will create 214,500 openings for truck drivers each year through 2035, mostly to replace existing drivers when they exit the field.
 trucking numbers concept
 cost of trucking and diesel thumbnail
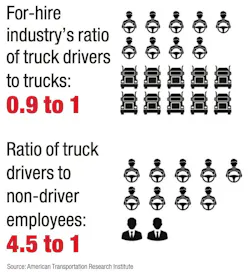
Trucks outnumber drivers, drivers outnumber other employees
According to the American Transportation Research Institute's (ATRI's) latest Operational Costs of Trucking report (which only captures for-hire operations), the ratio of truck drivers to trucks dropped to 0.9 in 2025. For every 10 trucks, only nine could be utilized based on driver availability.
The ratio of truck drivers to trucks has fallen steadily over the course of the freight recession. The ratio peaked above 1.0 in 2019 (1.02) and 2020 (1.03) but normally sits somewhere around 0.92 to 0.98.
The ratio of truck drivers to non-driver employees varied by segment under ATRI's data. The broad truckload segment in 2025 employed 4.5 drivers to 1 non-driver. The refrigerated segment only employed about 3.0 drivers to 1 non-driver. The less-than-truckload segment employed a very low 1.2 drivers to 1 non-driver.
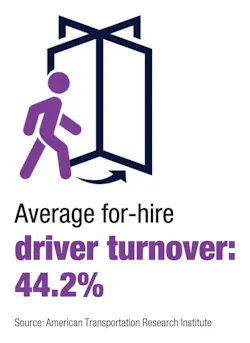
For-hire driver turnover rate: 44.2%
Driver turnover is a storied industry challenge. Long-haul drivers face a demanding, isolating, and underappreciated job that can disrupt their mental health. Without strong geographic ties, long-haul drivers also have a high degree of freedom to jump between employers.
ATRI's latest operational costs report estimated that the for-hire industry's annual turnover rate was about 44.2% in 2025, down from 48% in 2024. ATRI found that turnover was highest among the largest truckload fleets (70.7% turnover) and was lowest among small specialized fleets (13.9% turnover).
On the private fleet side (read more below), turnover is much lower—likely due to a mix of wages, routing, culture, and responsibilities.
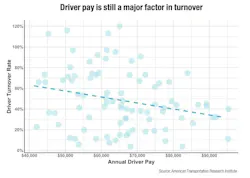
And ATRI's report certainly supported the idea that higher pay reduces turnover. Broadly, the group found that increasing a driver's annual pay by $5,000 was associated with a 2.9% decrease in average turnover.
Pay is not the only factor in turnover, though. ATRI also found that dwell times had an association with retention. An additional 30 minutes of average dwell time was associated with a 5.4% increase in average turnover. It begs a question: Would that association change under fleets that pay for dwell time?

Average for-hire driver wage: $0.818 per mile
Across truckload, specialized, and LTL, the average driver wage was $0.818 per mile, according to ATRI. The average per-mile spend on driver benefits was about $0.210 per mile.
As noted before, specialized fleets have lower turnover than truckload fleets. ATRI found that specialized fleets also pay their drivers slightly more per mile. Ironically, the largest truckload fleets—which faced the highest turnover rates—also tend to pay the most ($1.007) in the truckload segment.
Driver wages increased only 2.5% in 2025, slower than general inflation for a second year in a row.
For annualized for-hire income, the American Trucking Associations 2024 Driver Compensation Study found that the median truck driver pay was about $76,420. Adjusting 2.5% for 2025 would bring that income closer to $78,330.
There's good reason to believe drivers' pay is increasing faster in 2026. Several major carriers have announced driver pay increases this year, as covered by Geert De Lombaerde on FleetOwner (Werner, J.B. Hunt, and Schneider National, to name a few).
For-hire rates finally rose
One major reason carriers can afford those pay bumps: This year's dramatic increase in for-hire rates.

Spot rates grew 3.4% each month
From October 2025 through September 2026, broker spot rates measured by DAT Freight & Analytics grew 3.4% monthly.
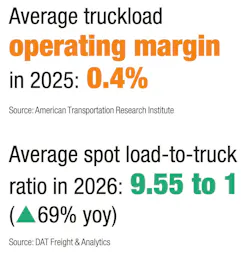
The average operating margin in 2025 was 0.4%
In the worst of the market's recession, for-hire trucking operating margins dipped negative, according to ATRI's 2024 data. Average margins inched back into positive territory in 2025, though by less than half a percentage point.
While operating costs are still rising, they likely aren't growing at the rate spot rates exploded in the last year.
Load-to-truck ratios averaged 9.55 to 1
In the same timeframe that spot rates grew, the average load-to-truck ratio on DAT was 69% higher than the year prior. The drastic change in available trucks—from a mix of regulatory enforcement and mass closures—helped drive rates up this year.
How private fleets compete for drivers
According to the National Private Truck Council's (NPTC's) latest Benchmarking Survey Report, private fleets have a driver turnover rate of only 17.1%.
The NPTC report uses 2025 operational data from 89 private fleet respondents.

Private fleets tend to run shorter routes than for-hire truckload fleets, and it shows in the NPTC report: about 58% of private fleet drivers can go home every night.
That amenity itself would likely be a great reason for a driver to stick around.

Those shorter routes also showed up elsewhere in NPTC's report: Private fleets buying Class 8 trucks purchased about 69% day cabs and only 31% sleeper cabs.
The private fleet distribution by weight class was also interesting: Private fleets in the survey ran 58% heavy-duty power units, 19% medium-duty power units, and 23% light-duty power units.

Average private driver's annual pay: $93,528
Compared to the ATA annualized salary above, private fleets surveyed by NPTC paid about 19% higher wages. The private driver pay rate in 2025 was up 3.1% YoY.
Only about 34% of surveyed private fleets consider themselves profit centers. Roughly 71% of private fleets surveyed also held for-hire authority, often using that authority to cover backhauls.
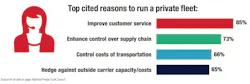
The benefits of a private fleet are not found in spot market rates. The survey's top-cited reasons to run a private fleet were:
- Improve customer service: 85%
- Enhance control over supply chain: 73%
- Control costs of transportation: 66%
- Hedge against outside carrier capacity/costs: 65%
About the Author
 Jeremy Wolfe
Editor
Editor Jeremy Wolfe joined the FleetOwner team in February 2024. He graduated from the University of Wisconsin-Stevens Point with majors in English and Philosophy. He previously served as Editor for Endeavor Business Media's Water Group publications.
Related
 trucking by the numbers 2025 cover
 Trucking by the numbers

