Trucking By the Numbers 2026: The scale of tariffs and truck demand
Key takeaways
- Heavy- and medium-duty truck orders in 2025 were about 14% below 2024 totals.
- Freightliner still holds 35.4% of the Class 8 market.
- Major North American manufacturers produced about 200,845 trailers in 2025, down 18% year over year.
- Section 232 tariffs added a 25% duty on many imported trucks and parts, while the nation's estimated effective tariff rate tripled to 7.2%.

This is the fifth part of Trucking By the Numbers, FleetOwner's annual feature on the industry's most important and interesting metrics.
This year's Trucking By the Numbers sections are:
- Overview and economy: How big (and healthy) is the trucking industry?
- Operating costs and fuel: Combustion fuel's explosive prices
- For-hire vs. private fleets, drivers: Driver stats, for-hire vs private
- Safety, enforcement: Trucks keep getting safer
- Equipment, tariffs: The scale of tariffs and truck demand
What does it look like to crawl out of a market recession so slowly?
Through the earlier sections of this year's Trucking By the Numbers, we saw the numbers behind the story: 1.2 million carriers, despite flatter freight demand, still enjoyed a rapid boost in for-hire rates over the last year. A fair piece of that boost went to competitive driver wages and rising operational costs (well, mostly diesel).
Despite those good for-hire rates, year-over-year comparisons for truck sales look less optimistic. Tariffs don't help with the problem.
2025 saw 208,386 heavy-duty truck sales in the U.S.
According to estimates from the December 2025 issue of American Truck Dealers' (ATD's) Truck Beat, heavy-duty truck orders in 2025 totaled 208,386 and medium-duty truck orders totaled 208,081; both totals were about 13-14% lower than their 2024 orders.
The latest ATD Truck Beat estimates truck orders from January through September 2026 likely totaled 150,987 for heavy-duty and 152,960 for medium-duty. Both totals are down 5-6% compared to the same 2025 period.
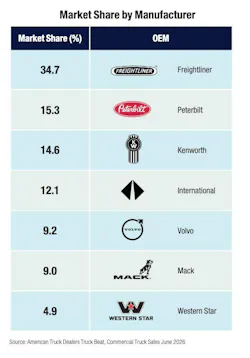
Freightliner remains the most popular Class 8 truck OEM, with 35.4% market share
The same September ATD Truck Beat issue, breaking down orders by manufacturer, finds that Freightliner still has the greatest market share for Class 8 trucks with 35.4% market share.
The next-closest truckmakers are far behind: Peterbilt with 15.1% market share and Kenworth with 14.6%. However, under the Paccar umbrella, the manufacturers combined make up a much closer 29.7% market share.
How does trailer manufacturing compare? We have good data from Trailer-Body Builders:
 trucking numbers concept
 truck weigh station queue with numbers
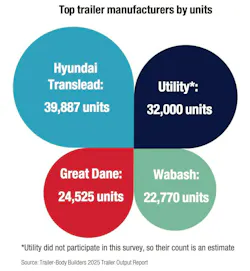
Major North American manufacturers built over 200,000 trailer units in 2025.
The Trailer-Body Builders annual Trailer Output Report gathered 2025 production data from 23 major North American trailer manufacturers.
In total, the top manufacturers produced about 200,845 units in 2025, down 18% year over year. The survey does not try to capture production details from the market's many smaller manufacturers, so the true 2025 trailer production total is likely a bit higher.
Hyundai Translead produced the most trailers: 39,887
Hyundai Translead retained the top spot for production volume, making 39,887 units (down 29% YoY). The likely runner-up for production volume would be Utility Trailer—however, the manufacturer did not participate in the survey this year, citing its ongoing trailer imports investigation.
The average truck age is 6.3 years. The average fleet's truck age is closer to 3.6 years.
According to ACT Research earlier this year, the average truck age is 6.3 years old, the highest average age in more than a decade. Carriers facing financial grief through the market recession are more likely to hold onto aging equipment.
The American Transportation Research Institute's (ATRI's) Analysis of the Operational Costs of Trucking 2026 Update contains useful 2025 survey data from several for-hire fleets, representing 182,248 combination trucks. According to the ATRI report, respondents' average truck age is 3.6 years.
That younger age better depicts larger fleets than carriers overall: About 84% of ATRI's operational cost survey respondents had five or more trucks, while 53% of overall registered motor carriers have just one truck. Smaller fleets and owner-operators are more likely to buy used trucks or keep their trucks after the OEM warranty ends.
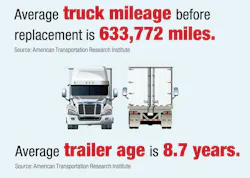
Average truck mileage before replacement is 633,772 miles.
From the same ATRI fleet survey data, surveyed for-hire fleets would replace their trucks, on average, every 633,772 miles—or every seven years.
Average trailer age is 8.7 years.
The fleets surveyed by ATRI also tend to keep their trailers longer than their tractors. Across 544,427 trailers, the average trailer age was 8.7 years.
Breaking that down by equipment type, the oldest average trailers among respondents were tank trailers (17.5 years), and the youngest were refrigerated trailers (4.1 years).
Tariffs add to equipment costs, hinder freight movement
Truck and trailer demand was down YoY in 2025, and truck sales in 2026 don't have much vigor yet either. Poor economic conditions certainly don't help, and neither does the inflationary elephant in the room: tariffs.
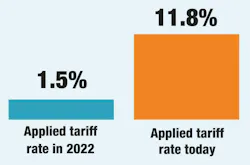
An extra 25% duty on heavy truck imports
Imports of Classes 2-8 trucks and parts now face an extra 25% cost increase under Section 232 tariffs, enacted in November 2025. The tariff proclamation includes exemptions for the United States-Mexico-Canada Agreement (USMCA) and a 3.75% offset for some approved manufacturers' products.
U.S. tariff policy has changed over 50 times since January 2025.
According to the Tax Foundation's analysis, there's good reason why "uncertainty" has dominated industry discussions since Donald Trump took back the presidency. U.S. tariff policy has changed over 50 times. And that doesn't even count all the social media posts.
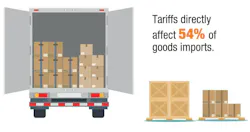
New Trump tariffs directly affect 54% of goods imports.
Another metric from the Tax Foundation: More than half of imports are covered by the string of tariffs introduced by Trump since 2025.
About 27% of all imports are affected by Section 301 tariffs—generally, these were introduced under the justification of "forced labor" and resembled the defeated IEEPA tariffs. The other 28% of all imports are affected by Sections 232, 338, and 201 tariffs. These sections were justified by claims of national security, discriminatory trade responses, and injury safeguards.
Effective tariff rates tripled
The Tax Foundation also estimates that the effective tariff rate—customs duty revenue divided by total goods imports—grew from 2.4% in 2024 to 7.2% today. In an industry hurting for freight demand, making imports more expensive is bad news.
About the Author
 Jeremy Wolfe
Editor
Editor Jeremy Wolfe joined the FleetOwner team in February 2024. He graduated from the University of Wisconsin-Stevens Point with majors in English and Philosophy. He previously served as Editor for Endeavor Business Media's Water Group publications.